Fig. 2.
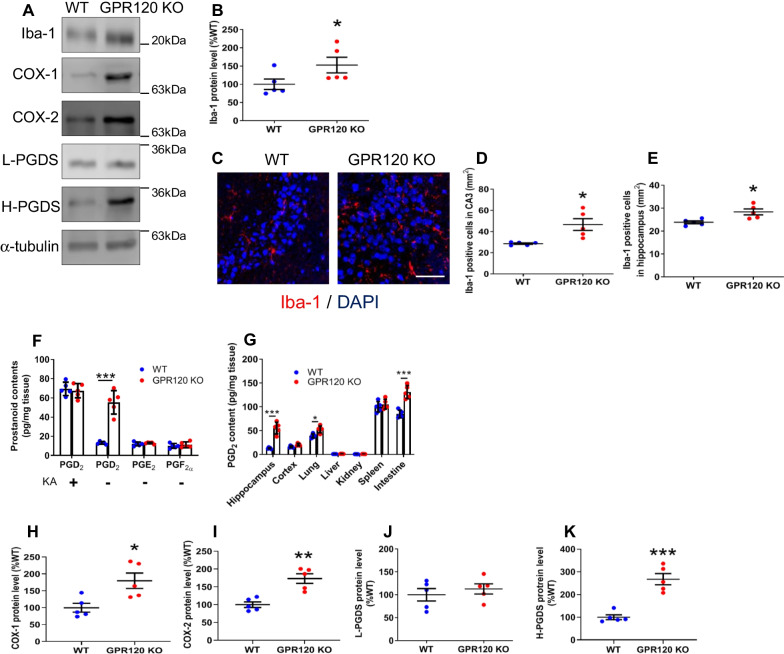
Microglial activation and PGD2 production observed in the hippocampus of WT and GPR120 KO mice. The protein level determined by western blot analysis (A). The level of Iba-1 protein in the hippocampus (B). The immunofluorescence of Iba-1 (C–E) and Iba-1 positive cell counts in the CA3 (D) and hippocampus (E). Scale bar = 50 μm. PGD2, PGE2, and PGF2α contents (F) in the hippocampus. PGD2 contents in each tissue (G). The level of COX-1 (H), COX-2 (I), L-PGDS (J), and H-PGDS (K) protein in the hippocampus. Data are means ± SEM, n = 5 per group. Statistical analysis was performed using unpaired Student's t test (*p < 0.05; **p < 0.01; ***p < 0.001 vs. WT)

