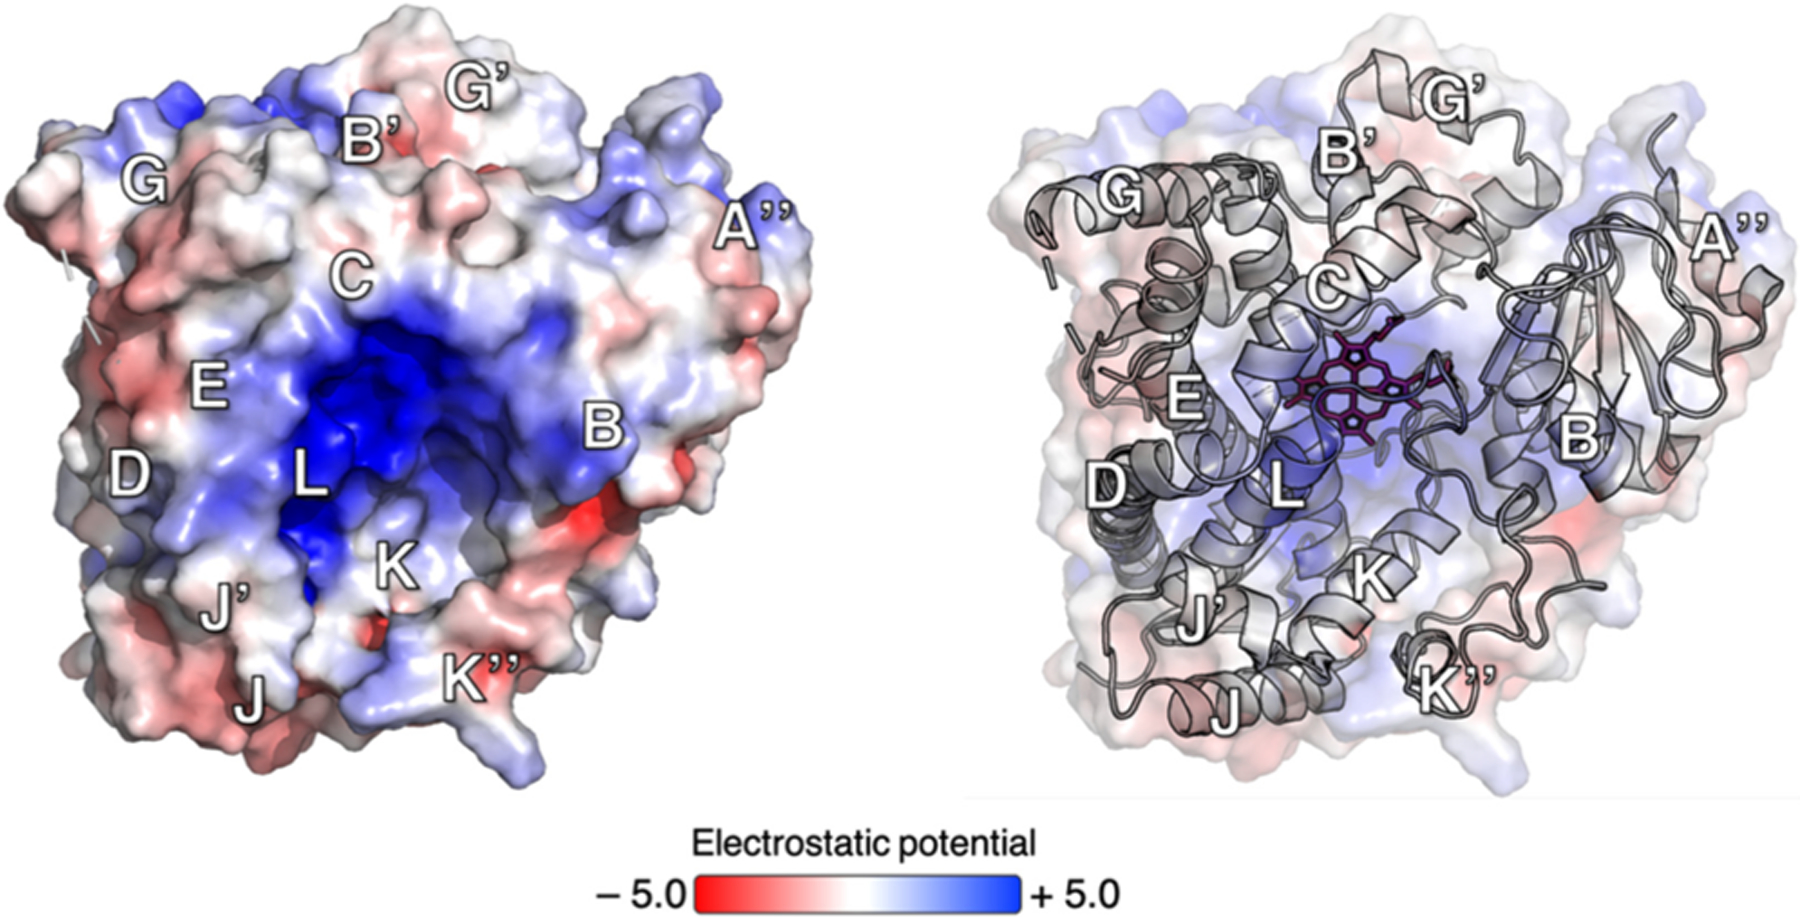
Figure 1.

Electrostatic potential (volts) of the CYP3A4 proximal surface relative to the heme group (red wireframe). Blue denotes regions displaying a positive potential, and red regions displaying a negative potential. The positively charged concave surface involves helices B, C, E, K, and L.
