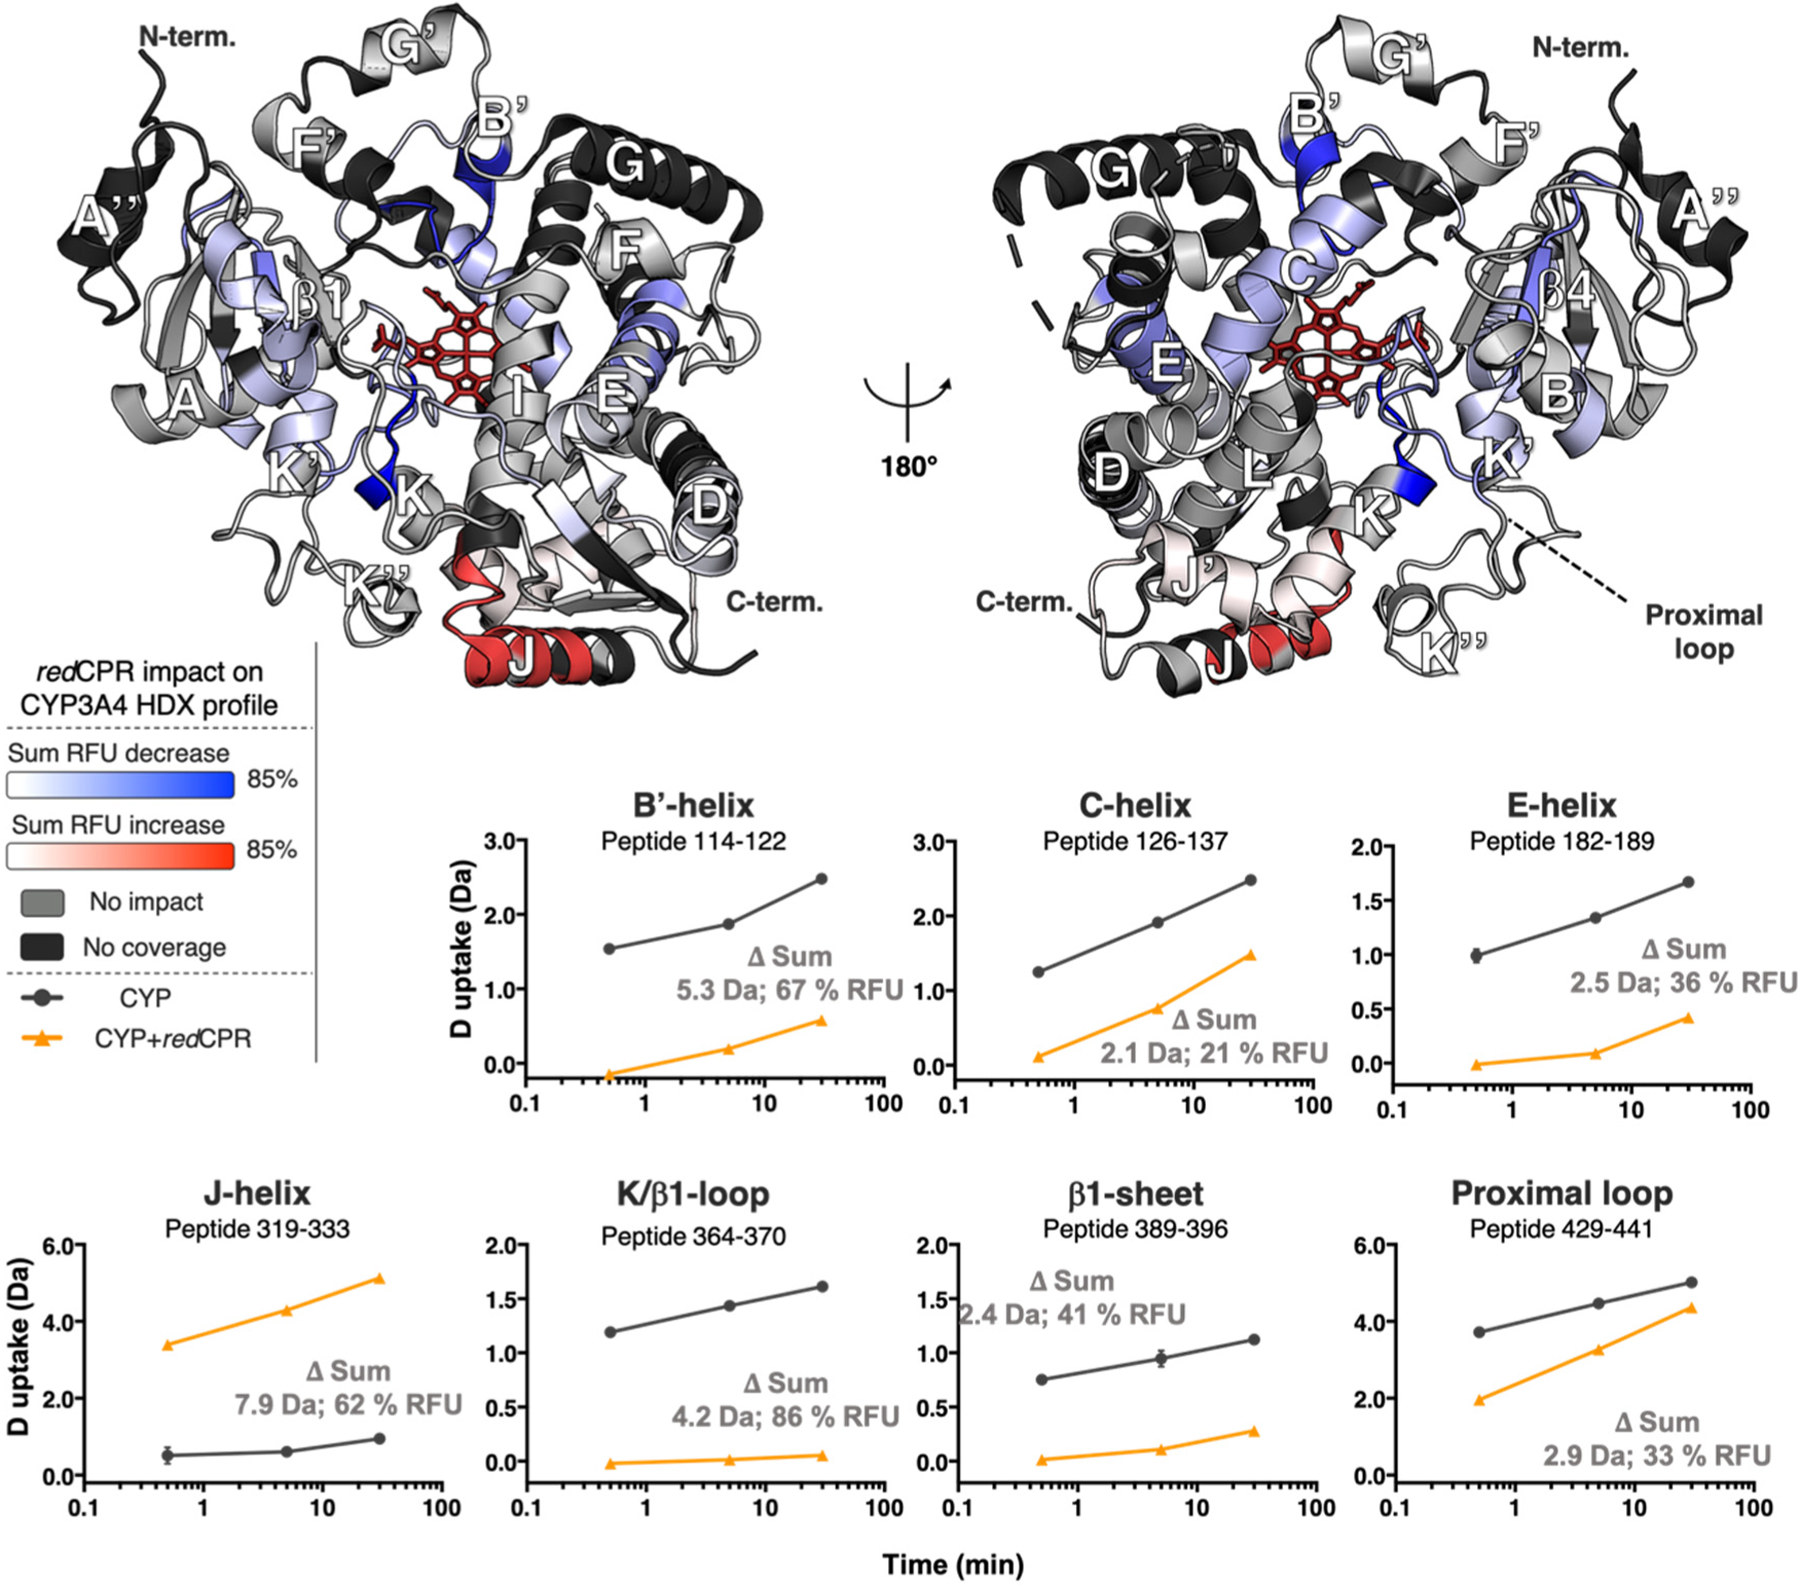
Figure 3.

Impact of redCPR binding on CYP3A4 dynamics represented by the deuterium uptake difference of the free enzyme, [CYP], minus the enzyme:CPR complex, [CYP:redCPR]. The significant sum RFU difference of the three time points (0.5, 5, and 30 min) is mapped onto the CYP3A4 structure (PDB entry 1W0F), which is shown in both distal (left) and proximal (right) views relative to the heme group (red wireframe). Blue denotes regions that undergo a decrease in the rate of deuterium uptake upon interaction with redCPR, whereas red designates regions that undergo an increase in the rate of deuterium uptake. The light gray color shows regions unaffected by redCPR binding, and the black regions were not covered by the MS analysis. Deuterium uptake time courses are shown for the most impacted peptides in the bottom panels. The sum of deuterium uptake and RFU difference is shown for each (CI of 99.9%, ±0.69 Da). The plots for CYP3A4 are colored black, and those for the [CYP3A4:redCPR] complex are colored orange. Error bars represent the standard deviations of triplicate measurements.
