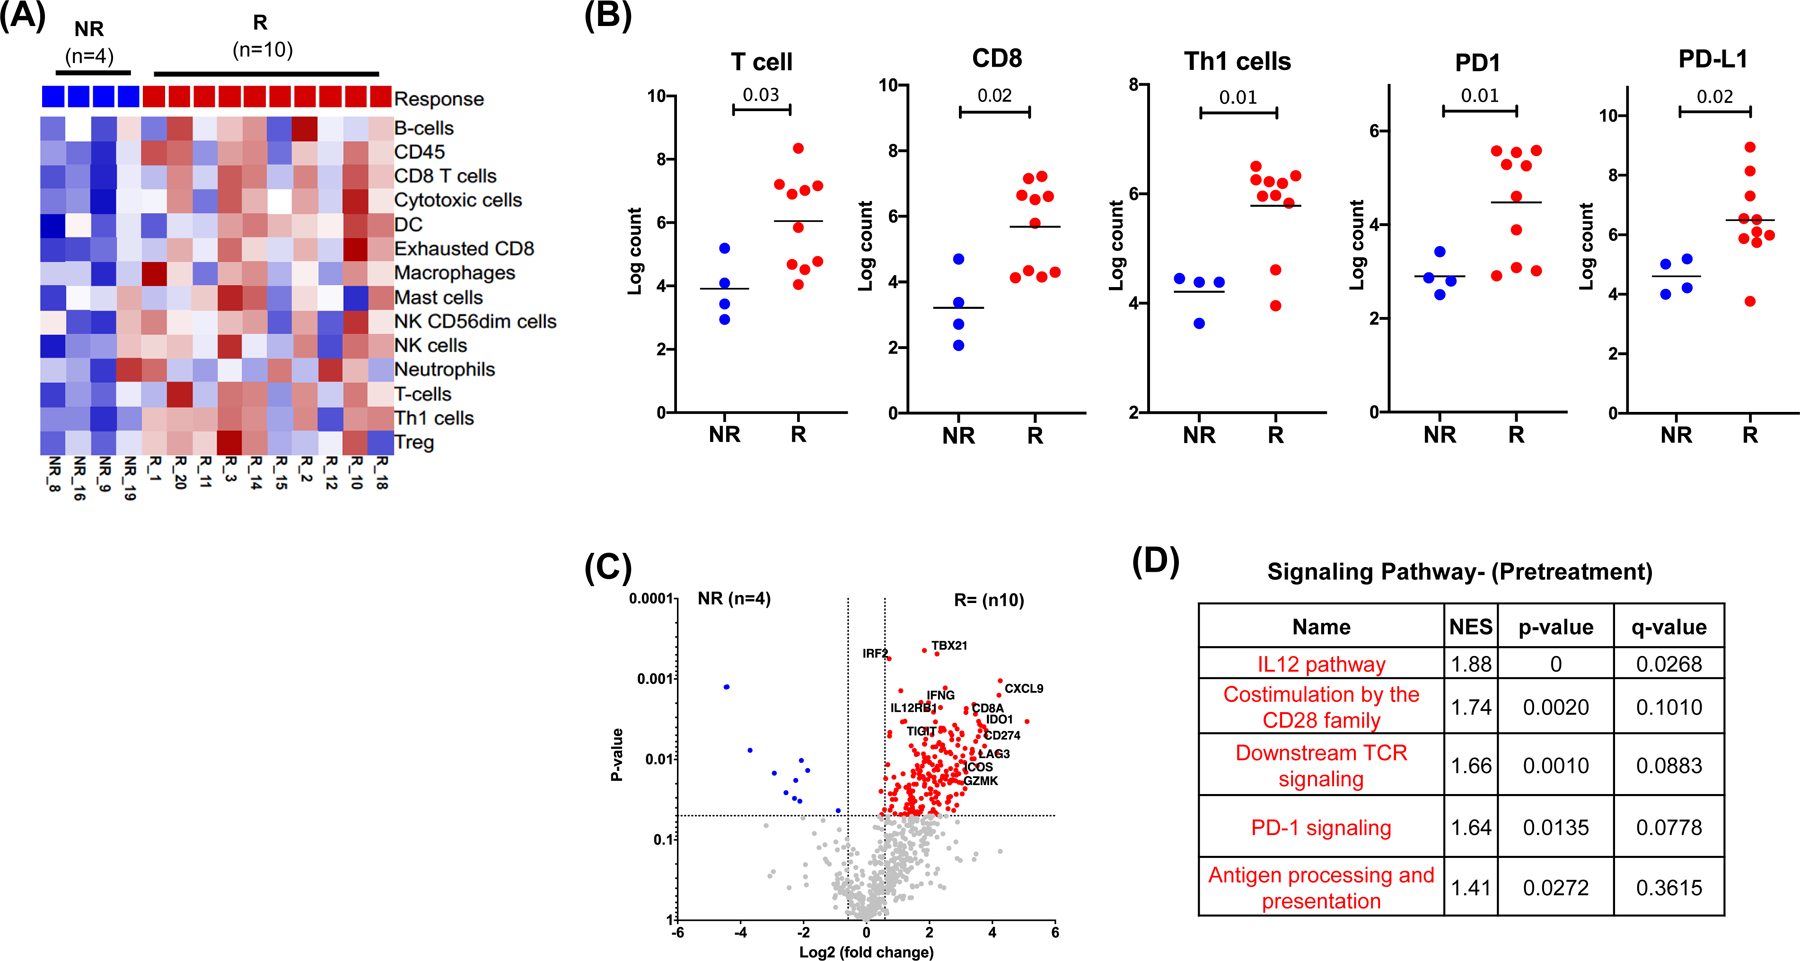
Figure 3. Favorable immune microenvironment prior to cemiplimab treatment is associated with pathological responses.

Pretreatment tumor specimens from pathological responders (R, red, n=10) and pathological non-responders (NR, blue, n=4) were analyzed for gene expression using a custom NanoString panel. (A) Heat map showing supervised clustering of immune cell infiltrates by response. (B) Scatter plots showing significantly different immune cell phenotypes between NR and R patients. Asterisks denote statistically significant differences. (C) Volcano plot of differentially expressed genes (Log2 FC>1.5 and P<0.05) by response. (D) Immune pathways with significantly different expression between R and NR patients per gene set enrichment analysis. NES, normalized enrichment score.
