
Figure 2. Characterization of hSpS.
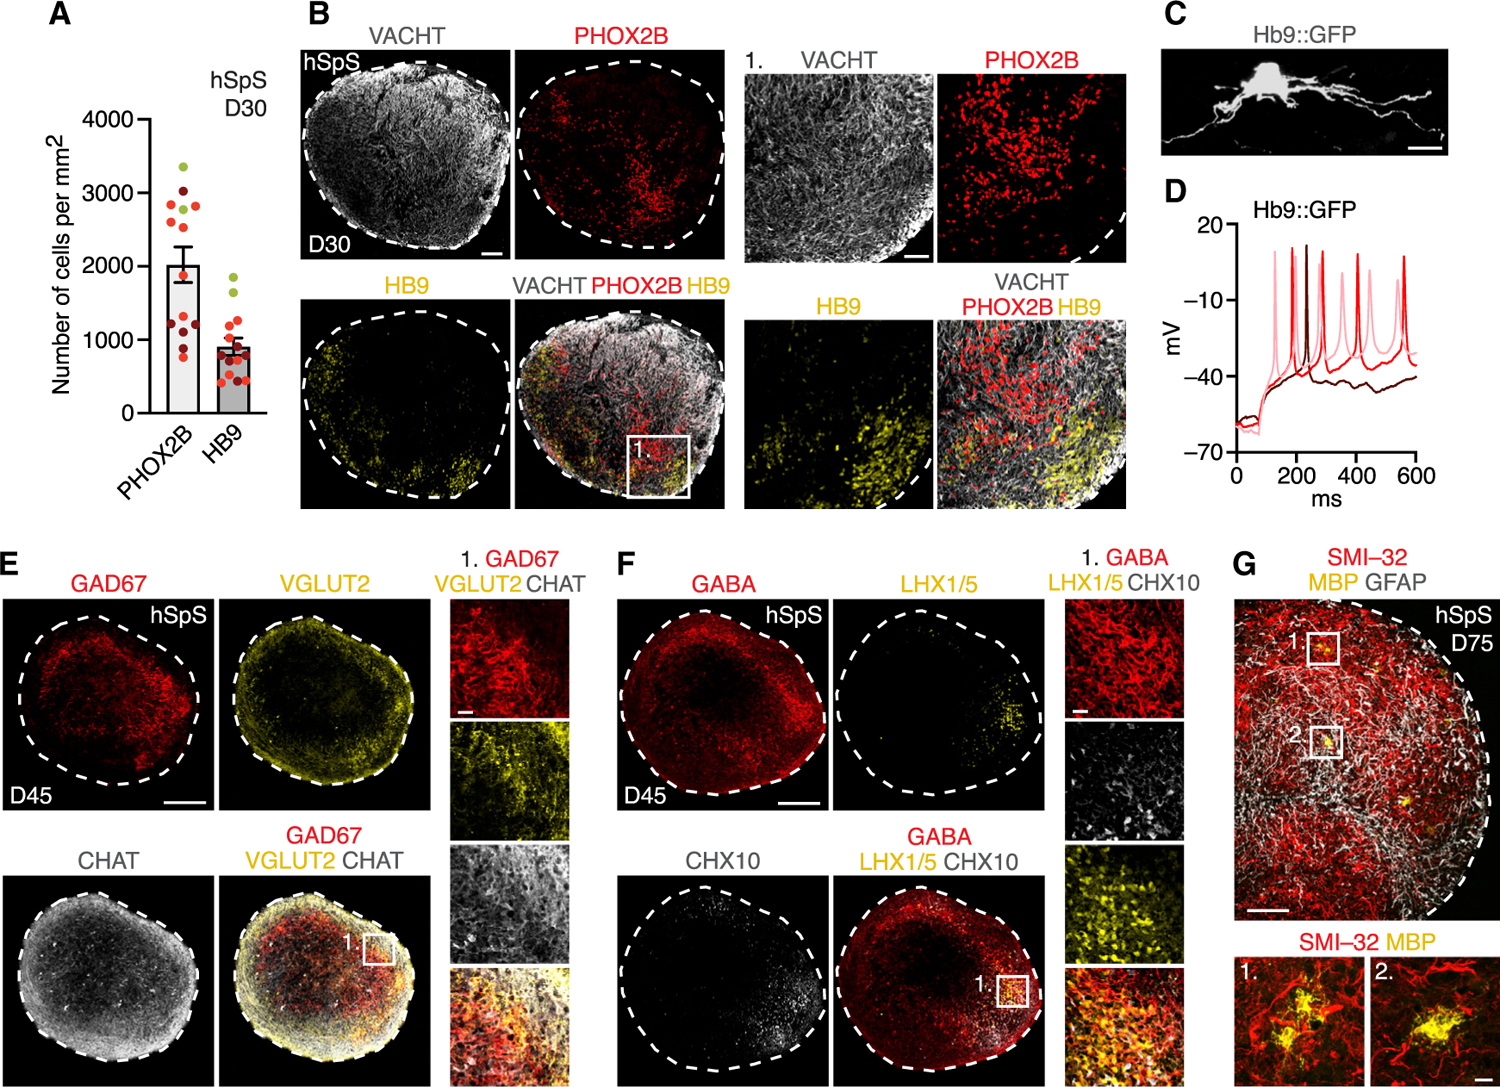
(A) Quantification of the total number of cells expressing PHOX2B or HB9 per area (mm2) in 16 µm hSpS cryosections at day 30. Data represent mean ± SEM (n = 14 hSpS derived from 3 hiPS cell lines from 1–2 differentiations, with 2–4 cryosections quantified per hSpS).
(B) Representative immunohistochemistry images of day 30 hSpS.
(C) Immunocytochemistry showing a lenti-Hb9::GFP+ neuron in an hSpS cryosection.
(D) Whole-cell current-clamp recording from an Hb9::GFP cell showing action potential generation in response to depolarizing current injections.
(E and F) Representative immunohistochemistry images of neuronal domains with diverse neurotransmitter identities on day 45 hSpS.
(G) Immunocytochemistry in day 75 hSpS showing expression of the astrocyte marker GFAP and the oligodendrocyte marker MBP.
Scale bars, 10 µm (C), inset in (G), 20 µm (insets in E and F), 50 µm (inset in B), 100 µm (B and G), and 200 µm (E and F).