
Figure 4. Functional Connectivity in hCS-hSpS Assembloids.
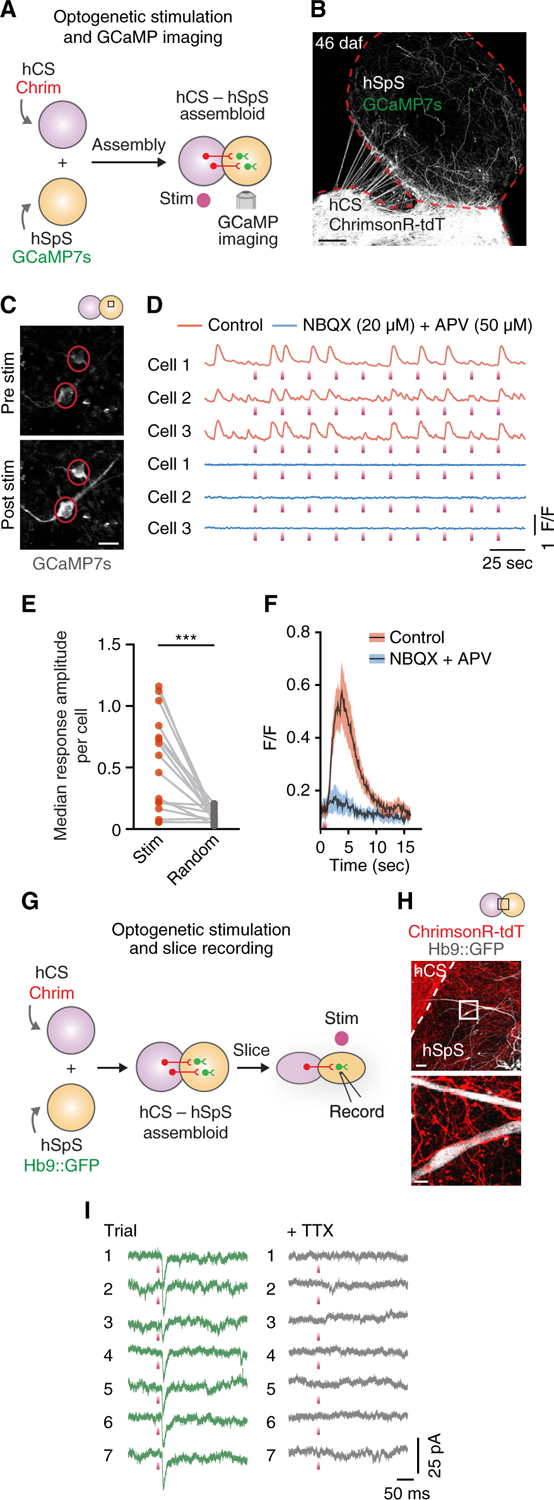
(A) Schematic detailing optogenetic stimulation coupled with GCaMP imaging in hCS-hSpS assembloids.
(B) Representative picture of intact hCSAAV-Chrim-hSpSGCaMP7s assembloid 46 days after fusion (daf).
(C) Representative images of two GCaMP7s-infected cells in an hCS-hSpS assembloid before and after optogenetic stimulation (625 nm, 100 ms each).
(D) Representative ΔF/F traces showing spontaneous and light-evoked calcium responses in three GCaMP7s-infected cells before and after adding NBQX (20 µM) and APV (50 µM). Optogenetic stimulation (625 nm, 100 ms each) is indicated with a purple rectangle. ΔF/F indicates the fluorescence intensity over baseline fluorescence.
(E) Quantification of the stimulation-triggered ΔF/F amplitudes, shown in comparison to randomized-triggered amplitudes (n = 16 cells from 4 assembloids derived from 2 hiPS cell lines from 1–2 differentiations; two-tailed paired t test: ***p = 0.0005).
(F) Stimulation-triggered average of the calcium response to optogenetic stimulation in paired cells with and without NBQX and APV (n = 16 cells from 4 assembloids derived from 2 hiPS cell lines). Black traces represent the mean and shaded bars represent the SEM.
(G) Schematic detailing optogenetic stimulation coupled with patch clamping slice recording in hCS-hSpS assembloids.
(H) Example images of an hCSAAV-Chrim-hSpSHb9::GFP assembloid.
(I) Chrimson-triggered EPSCs in an Hb9::GFP+ neuron voltage clamped to –70 mV, (left) and lack of EPSCs following TTX application (right).
Scale bars, 10 µm (inset in H), 20 µm (C), 50 µm (H), and 200 µm (B).
See also Table S1.