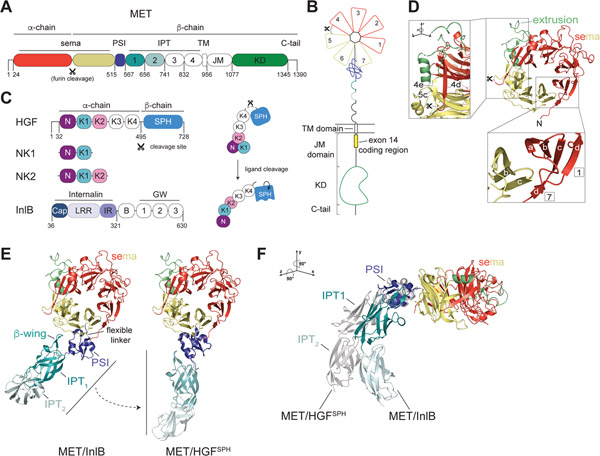
Figure 1: Architecture of the MET extracellular domain.
(A) Domain architecture of the MET receptor which includes the sema domain, PSI (Plexin, Semaphorin, Integrin) domain, IPT (Integrin, Plexin, Transcription factor) domain, TM (transmembrane) domain, JM (juxtamembrane) domain and KD (kinase domain). Residues at domain boundaries are marked. The furin cleavage site in the sema domain is indicated with a scissors sign. (B) Cartoon representation of the domain structure of the full-length MET receptor colored relative to (A). The extracellular domain (ECD) includes the sema domain and the stalk region (PSI-IPT1–4). Numbers in the sema domain denote individual blades of the β-propellor structure. Exon 14 in the membrane proximal region of the JM domain is marked by a yellow box. (C) Domain architecture of MET ligands: HGF, NK1, NK2 and InlB. The HGF cleavage site, which generates the mature α- and β-chains of the ligand, is marked with a scissors sign. Domain abbreviations are: N (N domain), K1-K4 (kringle domains 1–4), SPH (serine protease homology domain), Cap (Cap domain), LRR (leucine rich repeat), IR (inter repeat region), B (B-repeat), GW (Gly-Trp domain). Domains colored in white have no associated high-resolution structural data. Panel on the right illustrates HGF ligand cleavage and proposed associated conformational changes that lead to formation of an active ligand. The N, K1 and K2 domain arrangement is based on crystal structures described in Figure 4A and B. (D) Crystal structure of the MET sema domain is shown in cartoon representation (PDB: 1SHY). PSI and SPH domains are removed for clarity. The extrusion region is colored lime green. (D, lower inset) The 4 anti-parallel β-strands (labelled a-d) that constitute each blade of the sema domain are shown for blades 1 and 7. Strand d of blade 7, which is contributed by the N-terminal region of the sema domain, encloses the structure. (D, high inset) The extrusion region is highlighted by rotation of the sema domain to demonstrate its continuation from blade 5c that continues back to form blade 4e. Two colored dots indicate an unresolved region of the extrusion (Thr 402-Arg 413). (E) Two orientations of the MET ECD in complexes with different ligands illustrate flexibility of the stalk region. Left, structure of MET in the MET/InlB complex (PDB: 6GCU) in which the InlB ligand has been removed for clarity. Right, structure of MET in the MET/HGFSPH complex (PDB: 1SHY), in which the HGFSPH domain has been removed for clarity, is also aligned via the PSI domain on the structure of the PSI-IPT1–2 module (PDB: 5LSP) to highlight the extended conformation of the stalk in this state. (F) The structures of MET/InlB and MET/HGFSPH (shown in grey) were aligned on their sema domains and rotated as noted relative to (E). HGFSPH and InlB ligands were removed for clarity.

