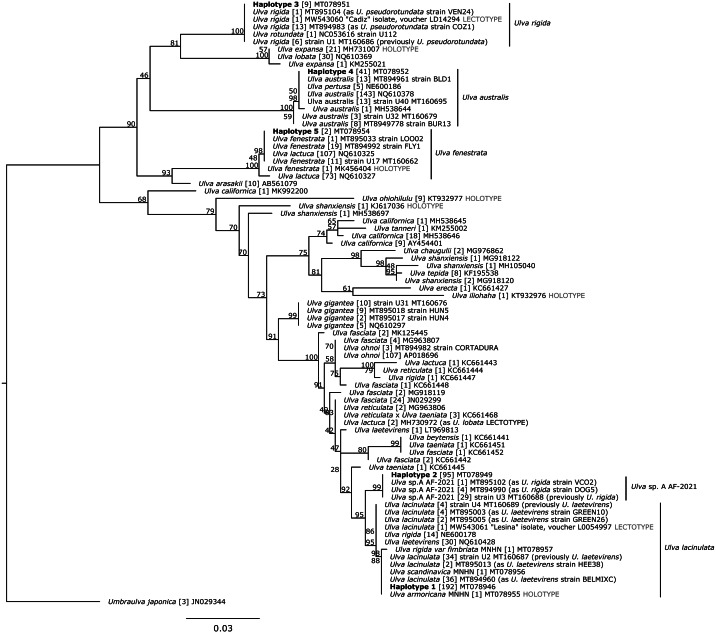
Figure 2. Maximum Likelihood (ML) phylogeny based on 500 bp of the tufA chloroplastic gene.
Haplotypes detected in this study are in bold. Bootstrap support values from the ML analysis are indicated under each node. Sample size, for each haplotype, is presented in brackets. Unit of scale bar: substitution/site. MNHN: Muséum National d’Histoire Naturelle, Paris. Taxon names follow Genbank records, as of the time of publication.

