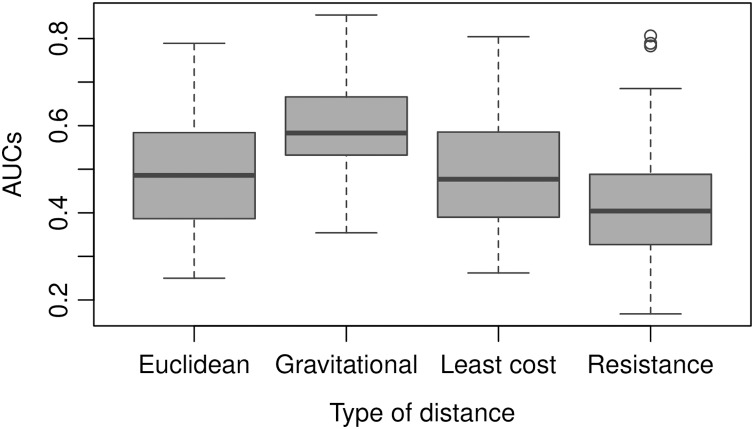
Figure 12. AUC obtained using different types of distances to predict weekly newly infected municipalities using the 20 nearest neighbours over the period February 23, 2020–October 2, 2021.
Average AUC values are 0.49, 0.60, 0.49 and 0.42 for Euclidean. gravitational, least-cost and resistance distance, respectively.

