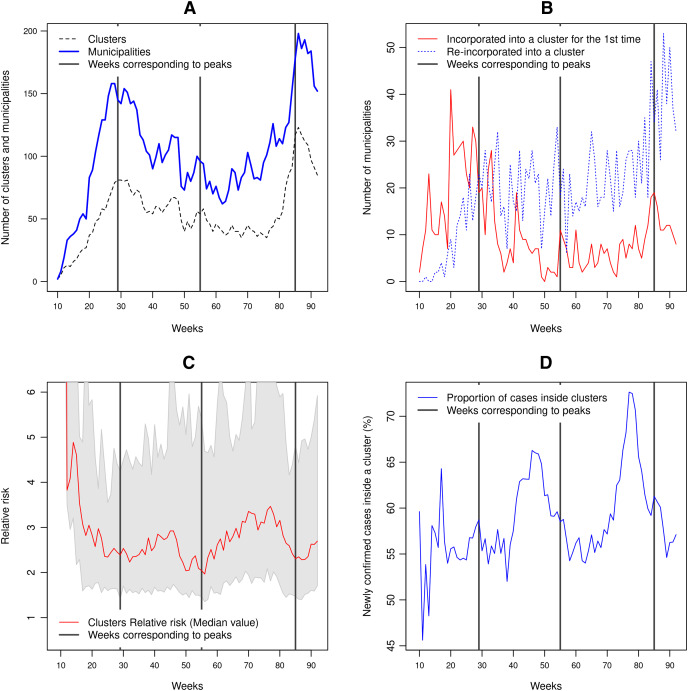
Figure 4. Clusters characteristics between February 23, 2020, to October 2, 2021 (weeks 9 to 92).
(A) Number of clusters and number of municipalities included into clusters, (B) number of municipalities incorporated for the first time into a cluster and number of municipalities re-incorporated into a cluster, (C) median relative risk value of the clusters. The grey-shaded region represents the area between the 10% and 90% quantiles, (D) proportion of the new confirmed cases belonging to a cluster.

