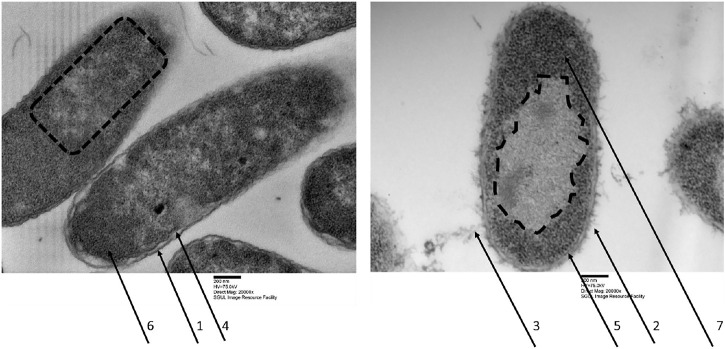
FIGURE 1.
Transmission electron micrographs of Escherichia coli, left untreated samples, right treated with optP7 for 60 min, 20,000 times magnification. The dotted lines indicate the nucleoid, arrows one and two show the outer membrane, three shows blebbing of the outer membrane and release of LPS, four and five show intact inner membrane, six and seven show granular structures in the cytosol.

