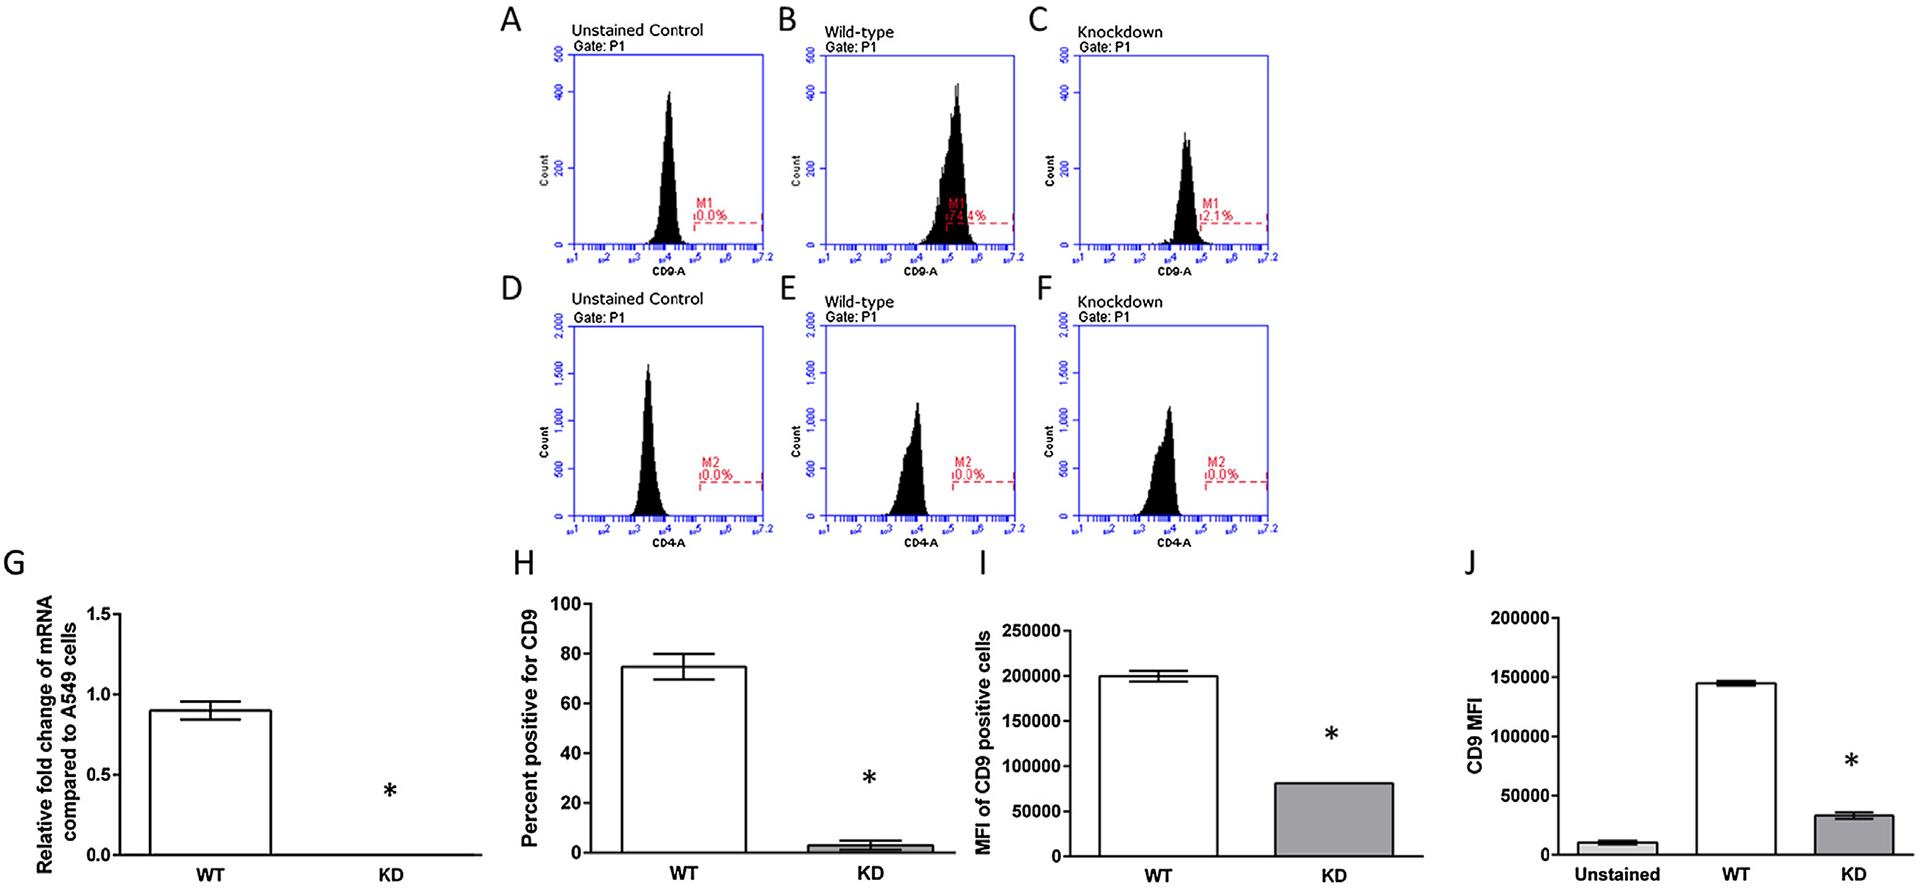
Fig. 1.

Characterization of CRISPR/Cas CD9 deletion clones. (A–C) Representative histograms of the WT and KD cells unstained or stained with an anti-human CD9 antibody. (D–F) Representative histograms of the WT and KD cells unstained or stained with an anti-human CD4 antibody. (G) Representative quantitative mRNA levels of knockout clones were compared to the parental A549 cells, which is indicated as an expression level of 0.1 mRNA expression levels of CD9 and Actin were quantified through RT-qPCR. Data presented are mean relative fold change ± SEM (n = 3). Asterisks indicate a significant difference between wild-type cells and knockdown cells (P < 0.05). (H and I) CD9 protein expression of CD9 knockdown clones. Cells were stained with an anti-CD9 antibody and the percent of cells that were CD9 positive (cells within the M1 gate) and the MFI of the gated M1 cells were quantified through flow cytometry. (J) MFI of all WT and KD cells quantified through flow cytometry. Data presented are mean relative fold change ± SEM (n = 3). Asterisks indicate a significant difference between wild-type cells and knockdown cells (P < 0.05).
