
Fig. 2.
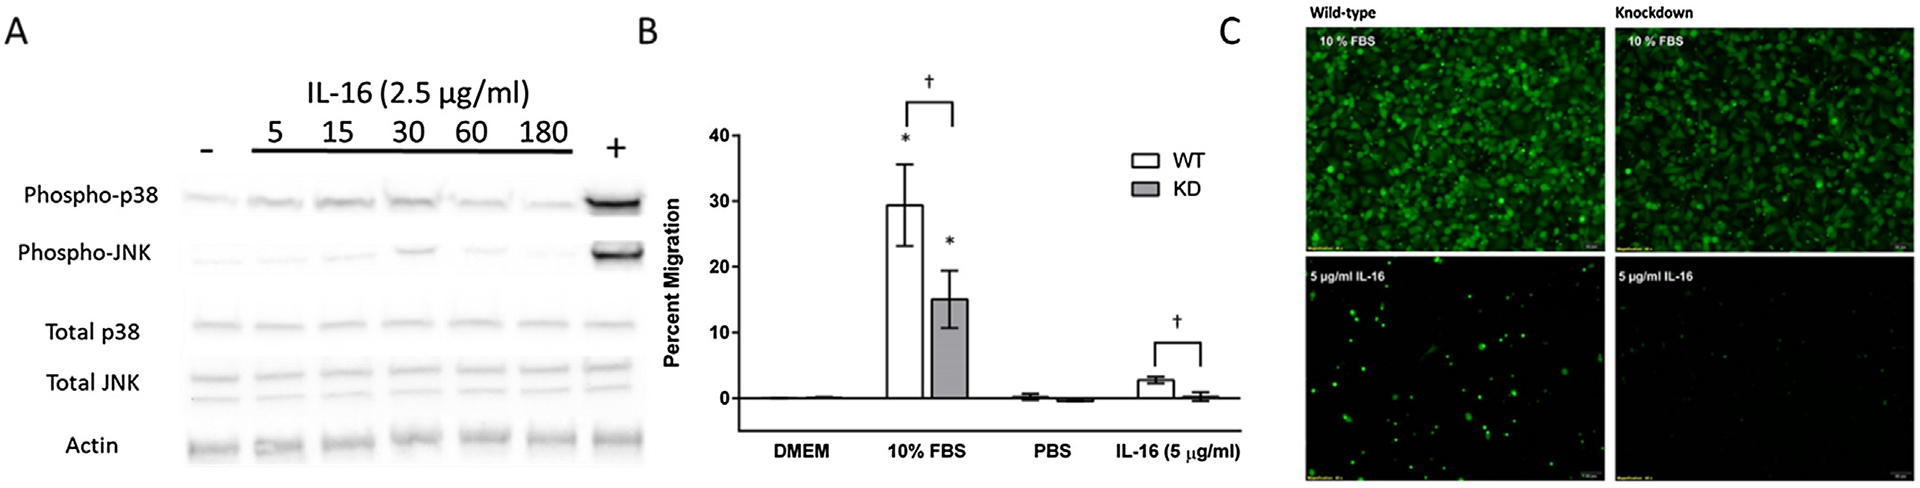
Cell activation and migration in the presence of IL-16. (A) Representative western blots from wild-type cells, which were incubated in the presence of IL-16 or IL-1β (positive control) and then probed for phosphorylated JNK and p38, total JNK and p38, and Actin. (B) Wild-type and knockout cells (5*106 cells/transwell) were incubated in the apical chamber and chemoattractants were added to the basal chambers for 20 h. Cells were stained 4 μg/mL Calcein AM and incubated for 1 h at 37 °C, 5% CO2. Fluorescence was read at wavelengths of 494/517 nm (Ex/Em). Data presented are mean relative fold change ± SEM (n = 5–9). (C) To ensure that fluorescence was correlated with the number of migrating cells, images from each transwells were obtained through fluorescence microscopy. Asterisk indicate a significant difference between control cells and cells exposed to 10% FBS (positive control) (P < 0.05). Daggers indicate a significant difference between wild-type cells and knockdown cells exposed to 10% FBS or IL-16 (P < 0.05).