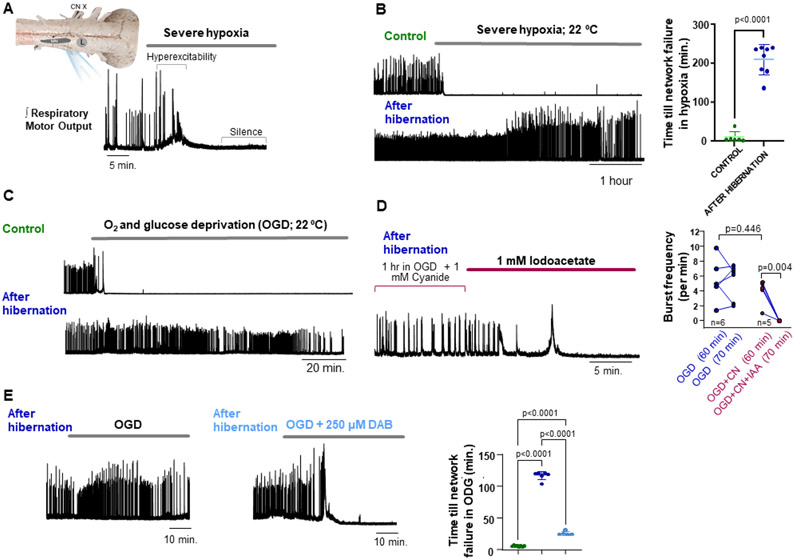
Figure 1. Dramatic improvement in circuit function during severe hypoxia (2% O2) and O2-glucose deprivation (OGD) after hibernation.
(A) Simplified schematic of the in vitro bullfrog brainstem preparation and activity produced by the respiratory network that generates breathing. Motor output is produced by a lung breathing rhythm generating network (L) that drives motor neuron discharge (MN; cranial nerve X recorded here). Integrated neurogram showing the typical response to severe hypoxia, involving hyperexcitability and shortly after, network silence. (B) Example integrated neurograms and mean time until silence of network output, illustrating the striking increase in duration of respiratory motor function during severe hypoxia following hibernation (control: n=6, hibernation: n=8). (C) Example oxygen and glucose deprivation (OGD) response before and following hibernation. (D) Example neurogram of a hibernation preparation exposed to cyanide (CN) + OGD to inhibit aerobic metabolism and then iodoacetate (IAA) to inhibit glycolysis (left). Plot on the right shows that at 60 minutes, OGD+CN have similar frequency to OGD alone indicating network function occurred without aerobic respiration. However, frequency falls following IAA exposure demonstrating glycolytic support of network activity. (E) Representative network responses to OGD in frogs after hibernation and after hibernation treated with DAB to inhibit glycogen phosphorylase. Mean data on the right showing the time until network failure during OGD in control (left, green, n=8), hibernation (middle, blue, n=6) and hibernation+ DAB (right, light blue, n=5). OGD. Dots represent data points from each preparation in individual experiments, horizontal bar is drawn at the mean, and error bars are S.E.M.

