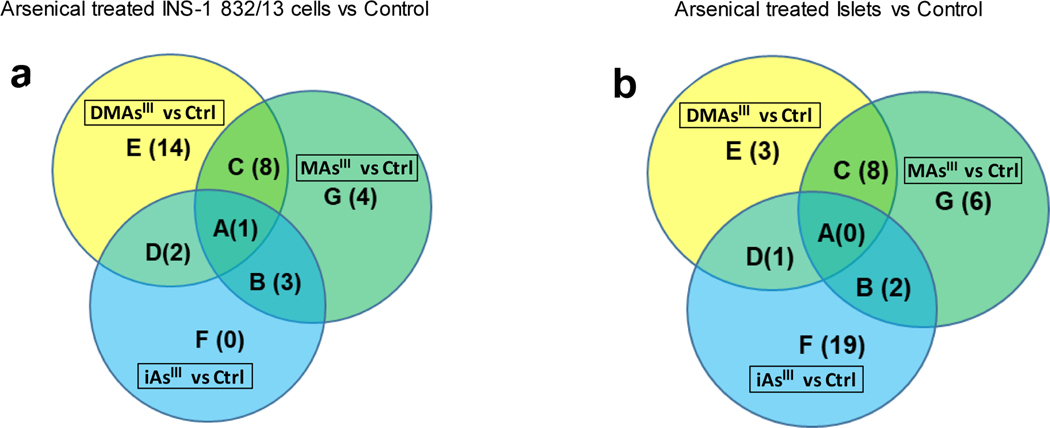
Figure 5:
Venn diagram of metabolic pathways perturbed in INS-1 832/13 cells (a) and islets (b) exposed to arsenicals as compared to unexposed controls (Ctrl). Pathway enrichment was conducted using Genego Metacore™, and the cut-off for pathway associations was p<0.05 (details are shown in Tables 3 and 4). Each section of the diagrams is labeled by a capital letter (A, B, C, D, E, F, and G) and numbers of pathways in each section are shown in parenthesis. The list of pathways corresponding to each section are shown in Tables 3 (for diagram a) and Table 4 (for diagram b).

