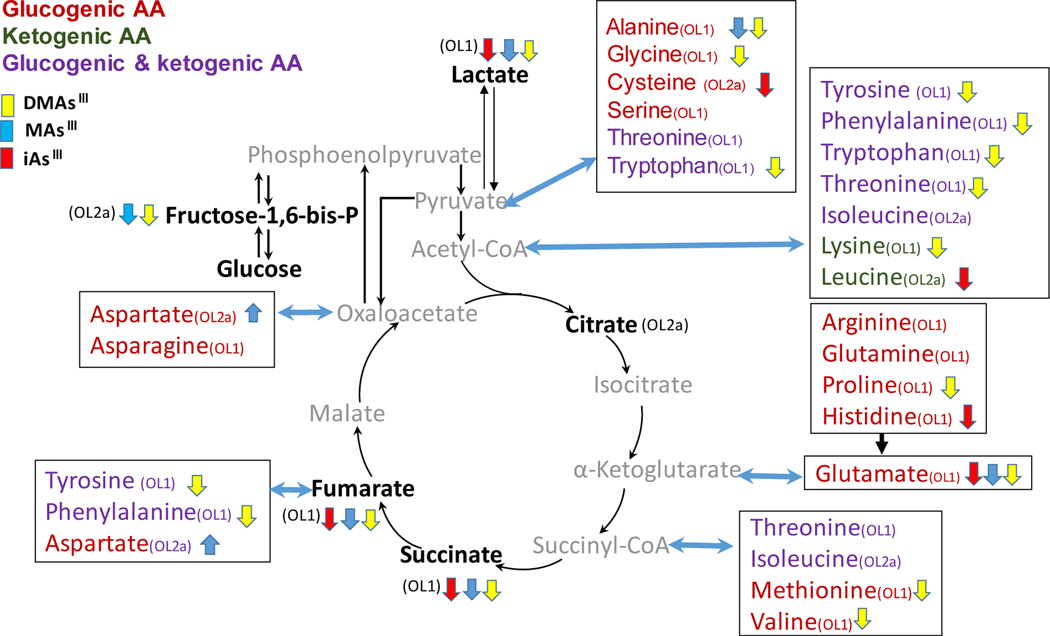
Figure 6:
Perturbation of carbohydrate-amino acid pathways in INS-1 832/13 cells exposed to iAs III, MAs III and DMAs III. Only metabolites identified with OL-1 (RT, MS and MS/MS) or OL-2a (RT and MS) are shown. Metabolites in gray were not found in the current untargeted analysis. Metabolites labeled with ↓ were downregulated and with ↑ were upregulated by the exposure (p<0.05); no significant changes were found for other metabolites. Box plots of key metabolites in the pathway are shown in Supplemental Figure 1

