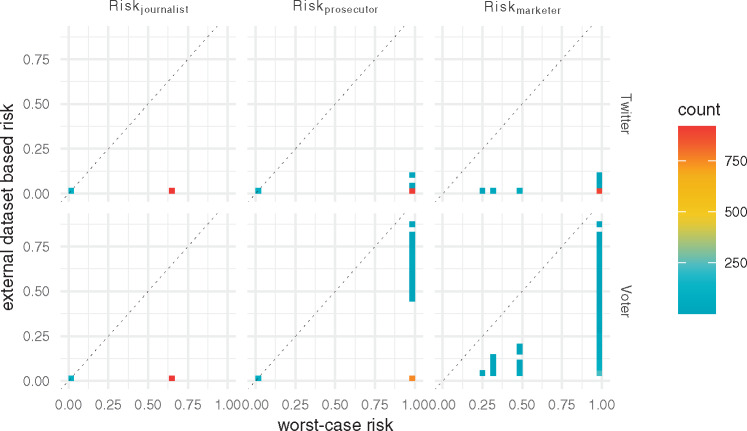
Figure 2.
Heatmaps for risk measures Riskjournalist, Riskprosecutor, and Riskmarketer in samples of 1000 records for the worst-case and pragmatic scenarios. The upper row is the worst-case risk (x-axis) vs the Twitter risk (y-axis). The bottom row is the worst-case risk vs voter registration risk. The points on the dashed line indicate that the worst-case risk is the same as the risk under the pragmatic attack scenario. The points on the x-axis indicate that the risk is reduced to 0 when shifting from the worst-case to the Twitter or voter registration list attack scenario.

