Figure 2.

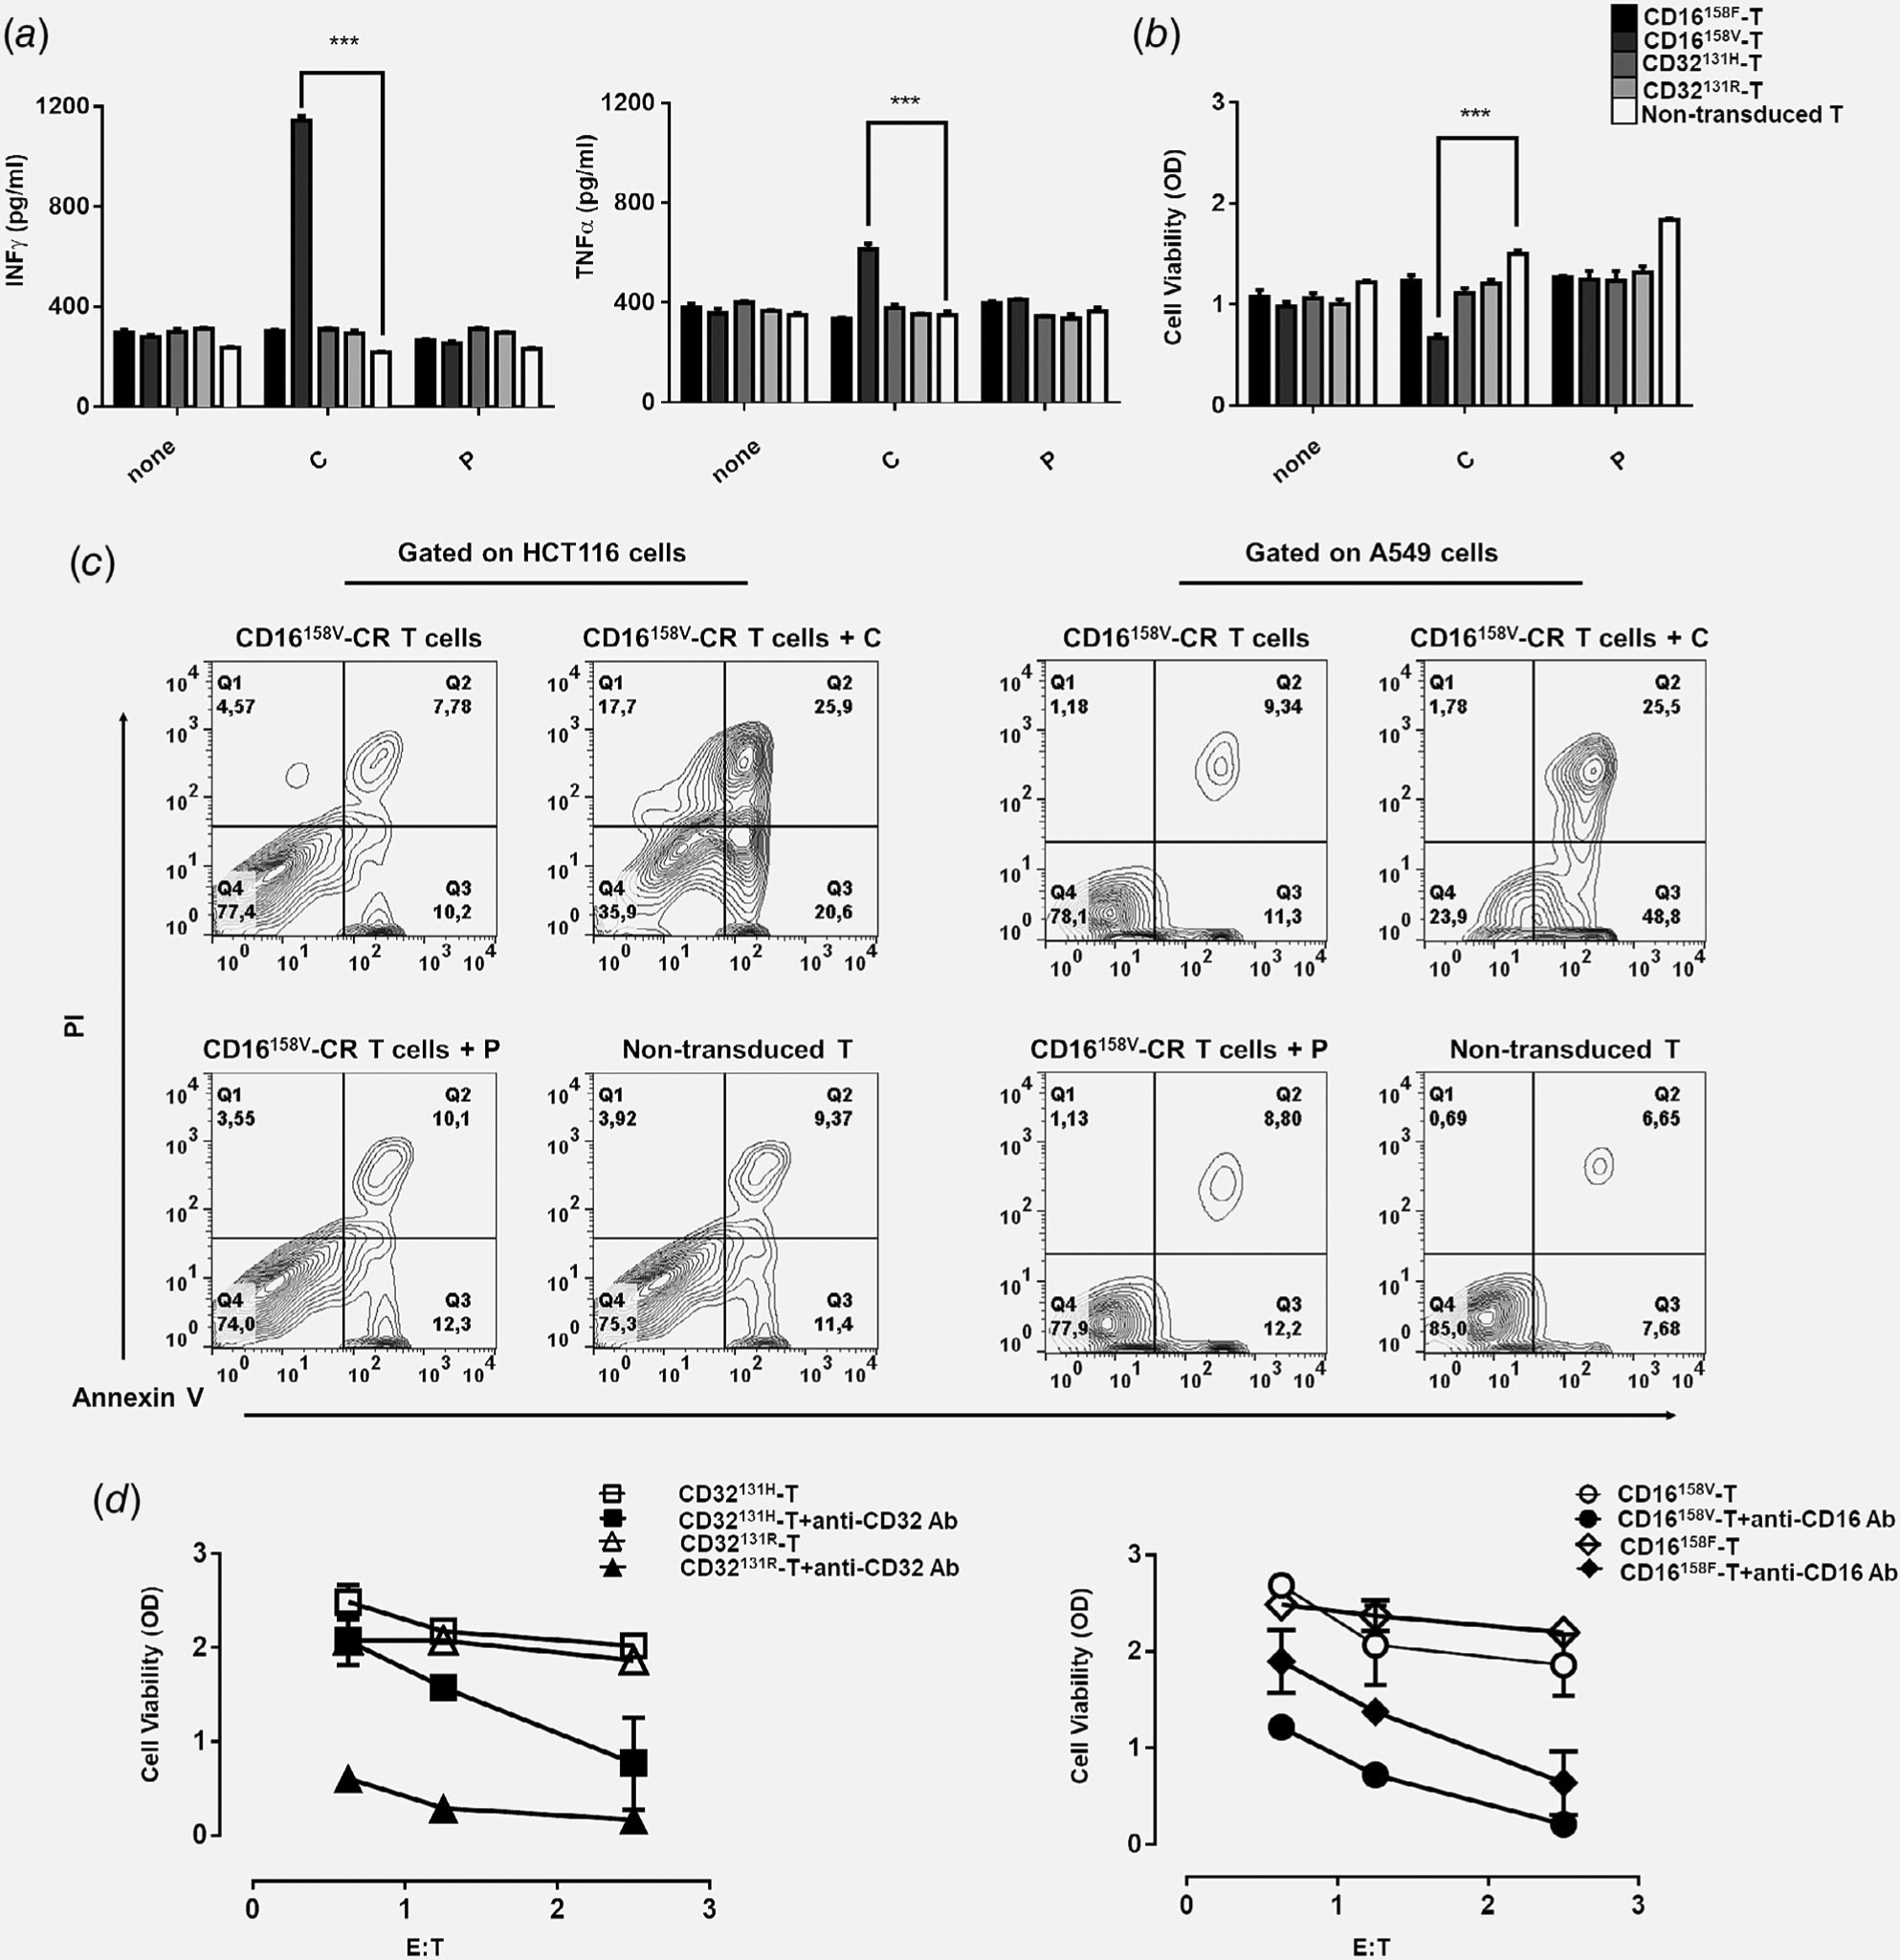
Recognition of HCT116 CRC cells by CD16158V-CR T cells in combination with cetuximab leads to proinflammatory cytokine production and HCT116 cell elimination. Panel (a) shows IFNγ and TNFα levels in supernatants of HCT116 cells incubated for 48 hr at 37°C with the indicated Fcγ-CR T cells in the presence or absence of cetuximab (3 μg/ml) or panitumumab (3 μg/ml), both at a E:T ratio of 5:1. Panel (b) shows viability, as evaluated by MTT assays of HCT116 cells incubated for 48 hr at 37°C with the indicated Fcγ-CR T cells with or without cetuximab or panitumumab at a E:T cell ratio of 5:1. C, cetuximab; P, panitumumab; white bars, nontransduced T cells. Asterisks indicate a p-value <0.001. The figure reports cumulative data, with mean ± SD values, of HCT116 cell viability obtained by using effector cells from five different donors in independent experiments. Panel (c) shows CD16158V-CR T cells killing of KRAS-mutated cell lines (HCT116 and A549) with or without cetuximab or panitumumab at an E:T ratio of 5:1. Nontransduced T cells were used as a control. After 16 hr, incubation cells were harvested, stained with APC-anti-CD3, FITC-annexin V and propidium iodide (PI), and analyzed by flow cytometry. Data are representative of five experiments independently performed. Panel (d) shows the results of redirected assays on the viability of stably transfected CD32 + HCT116 cells, as measured by the MTT assay. Fcγ-CR T cells were incubated for 3 days, at 37°C with CD32 + HCT116 in the presence or absence of anti-CD16 mAb (3 μg/ml) (right panel) with or without anti-CD32 mAb (3 μg/ml) (left panel) at the indicated E:T cell ratio. Viability of HCT116 target cells was then measured as described in the Methods section. Asterisks indicate p < 0.001.
