
Figure 3.
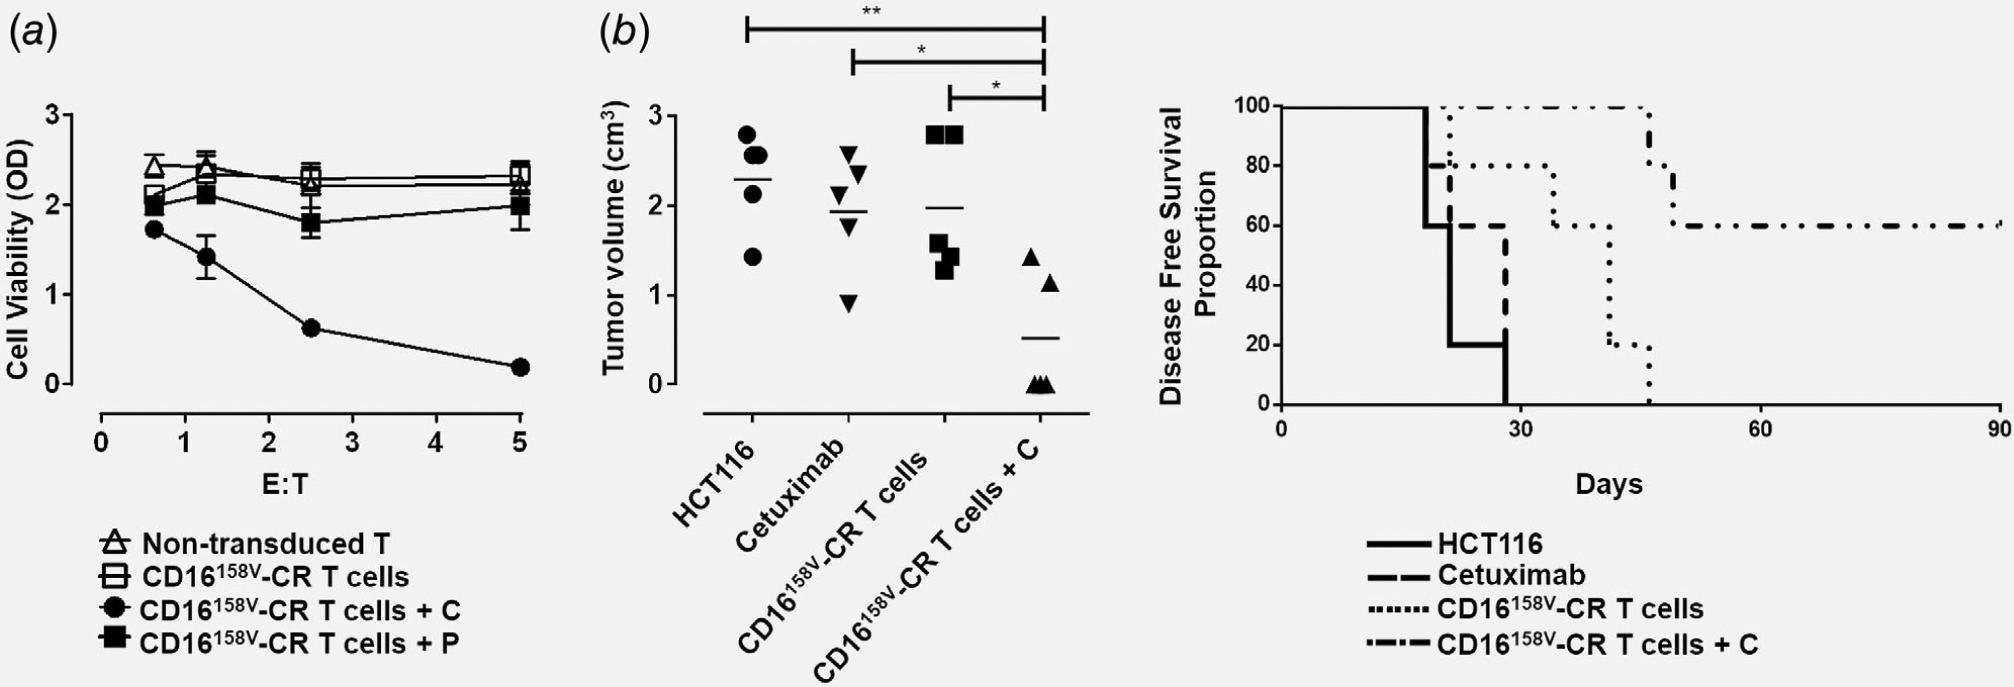
CD16158V-CR T cells in combination with cetuximab protect CB17 SCID mice from subcutaneous growth of KRAS-mutated HCT116 cancer cells. Panel (a) shows HCT116 cells incubated for 72 hr, at 37°C, in the presence or absence of CD16158V-CR T cells at the indicated E:T ratios with or without cetuximab (C) or panitumumab (P) both at the concentration of 3 μg/ml. Nontransduced T cells were used as a control. HCT116 cell viability was evaluated by MTT assay. Values are expressed as mean ± SD. Data are analyzed by a two-way ANOVA test. Panel (b) shows four groups of CB17 SCID mice (N = 5 per group) injected with HCT116 cells (1 × 10⁶) subcutaneously, in the right flank. Following HCT116 injection, three groups of mice were injected, in the area adjacent to HCT116 injection, with 150 μg of cetuximab (group 2), 5 × 10⁶ CD16158V-CR T cells (group 3), and 5 × 10⁶ CD16158V-CR T cells plus 150 μg of cetuximab (group 4). HCT116 cell growth was then monitored. Left panel shows a scatterplot analysis of tumor volumes resulting from subcutaneous injection of KRAS-mutated HCT116 cells 64-days postinjection. Right panel shows DFS analysis, as evaluated by the log-rank (Mantel-Cox) test. *p < 0.02, **p < 0.001.