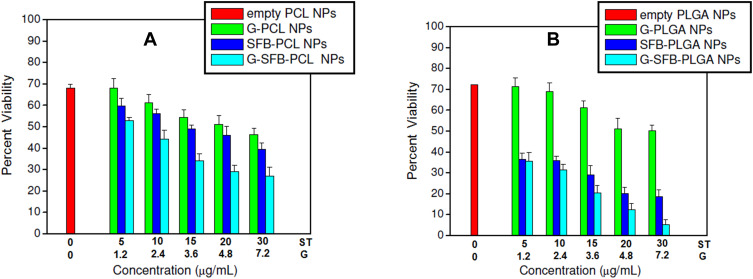
Figure 6.
Viability of HepG2 cells after incubation with different PCL NPs and PLGA NPs for 48 h followed by γ-radiation (6 Gy). Test concentrations of ST in the nanoparticles were chosen according to IC50 of ST, lyophilized NPs were weighed and the corresponding gold concentration were calculated according to gold analysis in the nanoparticles.
Notes: For the combined models, X axis represents the conc. of G and ST. However, for G/polymer NPs, conc. of ST is zero. Similarly, for ST/polymer NPs, conc. of gold is zero.

