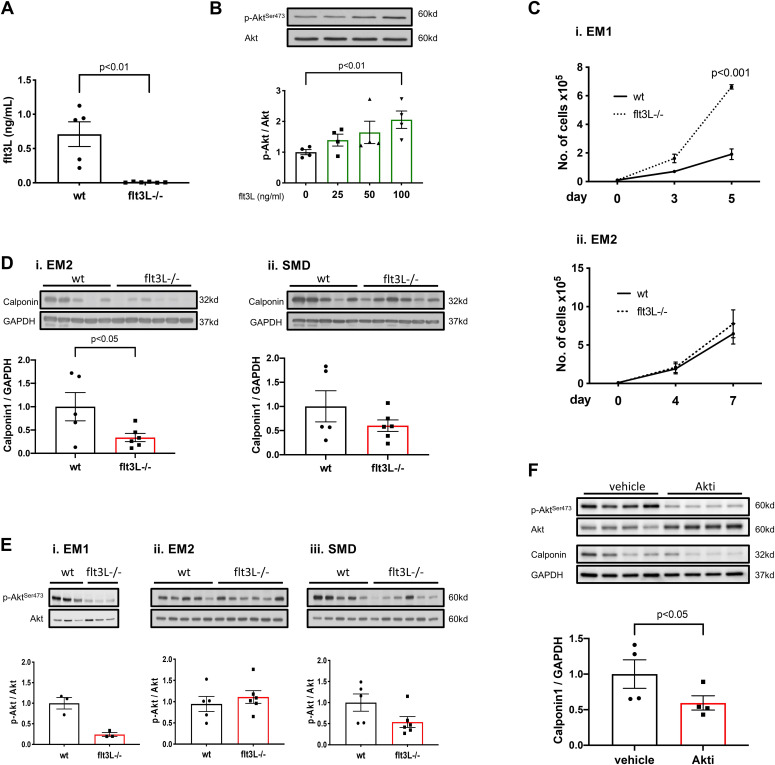
Figure 2. Differences in in vitro behavior unveil a shift in the proliferation-differentiation balance of flt3L−/− side population (SP)-CPCs.
(A) Flt3L quantification in supernatant from cultured wt and flt3L−/− Sca1+/CD31− SP-CPCs after 48 h in EM2 measured by ELISA. N = 5 and 6, unpaired t test. (B) Recombinant Flt3L-inducible signaling in wt SP-CPCs in EM1. N = 4, Kruskal–Wallis test, followed by Dunn’s multiple comparison test. Representative blots are shown. (Ci) Sca1+/CD31− SP-CPC proliferation curve in EM1, wt versus flt3L−/−, n = 3, unpaired t test at final timepoint. (ii) SP-CPC proliferation curve in EM2, wt versus flt3L−/−, n = 5 and 6; unpaired t test at final timepoint, P = 0.59. Starting cell number = 1 × 10⁴. (Di) Calponin protein expression in EM2, wt versus flt3L−/−, n = 5 and 6; unpaired t test. (ii) Calponin protein expression in smooth muscle differentiation medium (SMD) at day 7, wt versus flt3L−/−, n = 5 and 6; unpaired t test, P = 0.24. Representative blots are shown. (Ei) Expression of phosphorylated Akt (p-Akt) in EM1, wt versus flt3L−/−, n = 3; Mann–Whitney U test, P = 0.1. (ii) p-Akt expression in EM2, wt versus flt3L−/−, n = 5 and 6; unpaired t test, P = 0.50. (iii) p-Akt expression in SMD at day 7, wt versus flt3L−/−, n = 5 and 6; unpaired t test, P = 0.08. Representative blots are shown. (F) Calponin protein expression in wt SP-CPCs in SMD at day 7, after treatment with vehicle or 2 μM Akt inhibitor, vehicle versus treated, n = 4; ratio paired t test. Representative blots are shown. All data are mean ± SEM.

