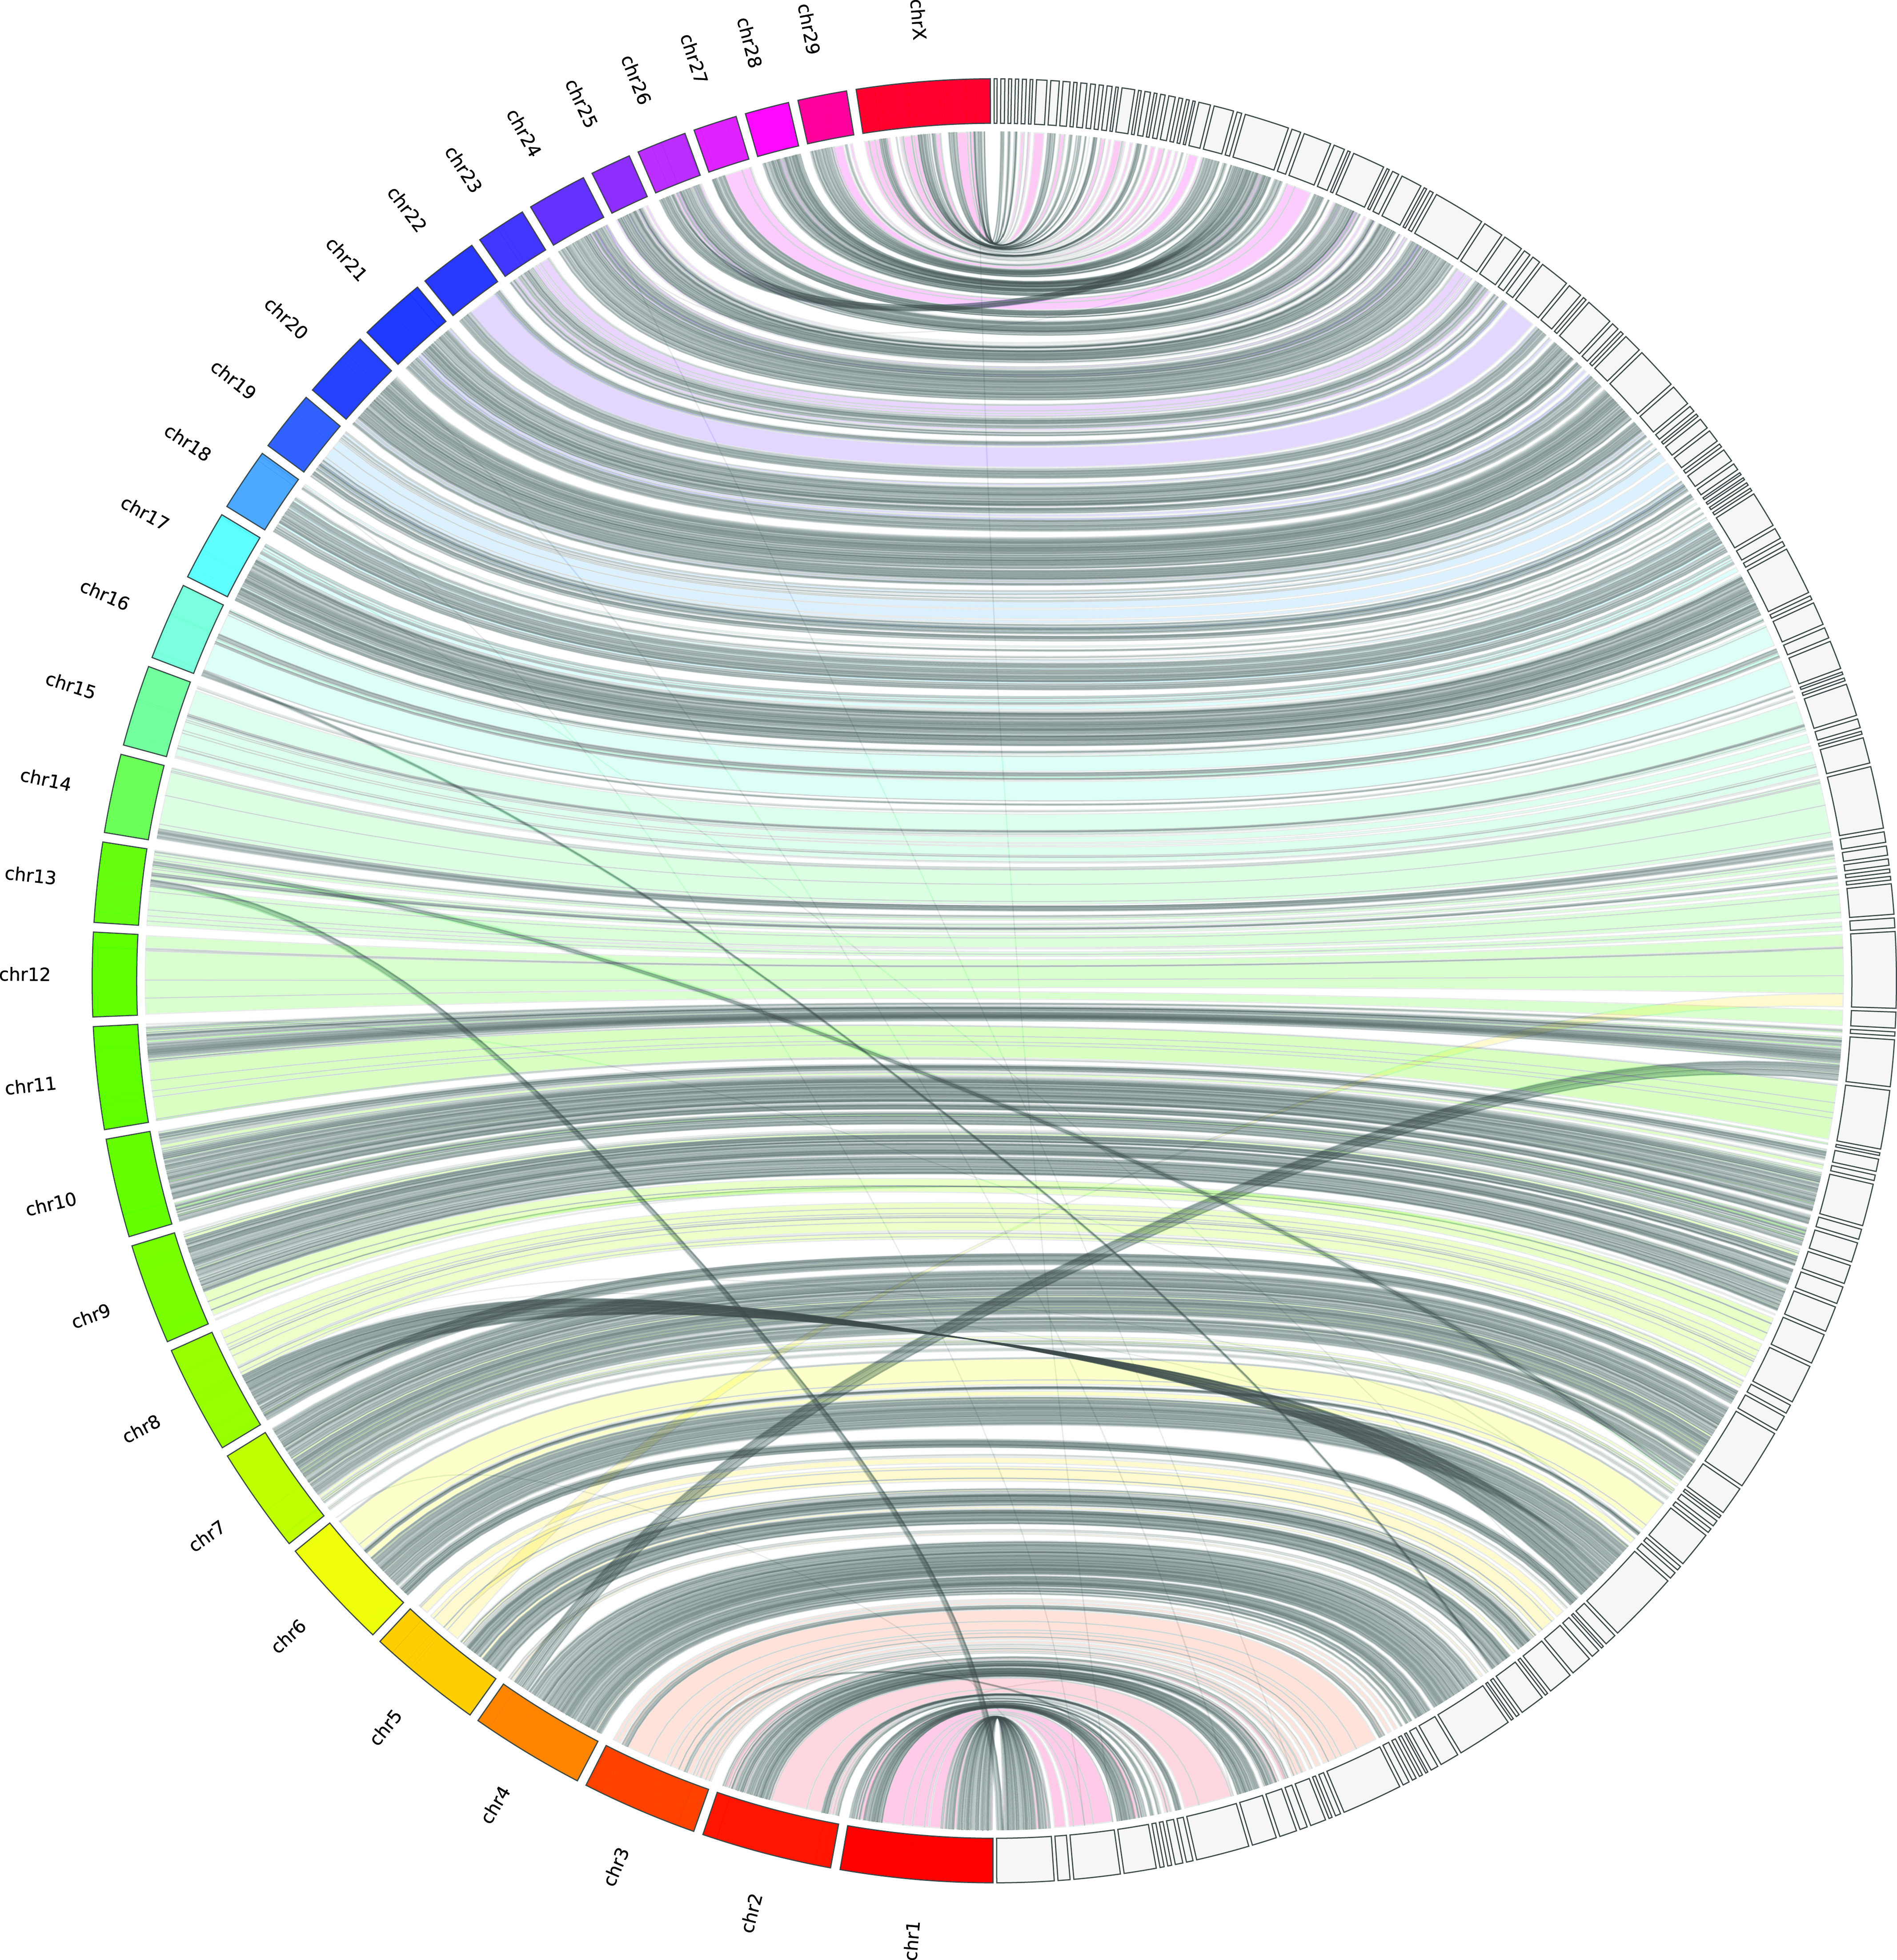
Figure 3. Synteny between caribou scaffolds and bovine chromosomes.

Rangifer tarandus genomic scaffolds were aligned with the Bos taurus reference (ARS-UCD1.2) using JupiterPlot (https://github.com/JustinChu/JupiterPlot). Bovine chromosomes are labeled on the left and the 144 largest matching caribou scaffolds are represented on the right. Colored bands indicate syntenic regions in the same sense, whereas grey bands indicate antisense synteny. Intersecting bands indicate non-syntenic regions between genome assemblies.
