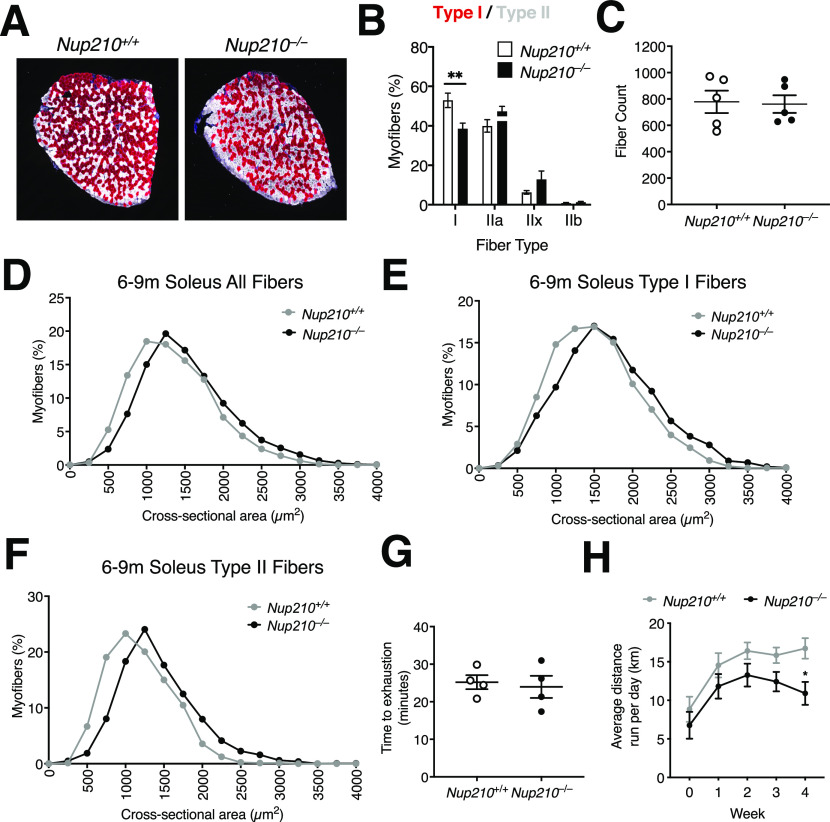
Figure 5. Nup210 is required for the maintenance of normal skeletal muscle fiber type distribution.
(A) Representative immunofluorescence images showing Type I (red) and II (white) fibers in soleus of 6- to 9-mo-old Nup210+/+ and Nup210−/− mice. (B) Quantification of fiber type distribution in soleus of 6- to 9-mo-old Nup210+/+ and Nup210−/− mice (n = 5). (C) Quantification of total fiber count for soleus muscles from 6- to 9-mo-old mice (n = 5). (D, E, F) Quantification of myofiber cross-sectional area for all fibers (D), Type I fibers (E), and Type II (IIa, IIx, and IIb) fibers (F) in soleus of 6- to 9-mo-old Nup210+/+ and Nup210−/− mice (n = 5). (G) Nup210+/+ and Nup210−/− mice were subjected to treadmill exercise and the time to exhaustion was quantified. (H) Nup210+/+ and Nup210−/− mice were subjected to 4 wk of voluntary running. The average distance ran per day each week was quantified and plotted. Data are plotted as mean ± SEM in (B), (C, G, H) and mean in (D, E, F). **P ≤ 0.01 by two-way ANOVA with Sidak’s multiple comparisons test.

