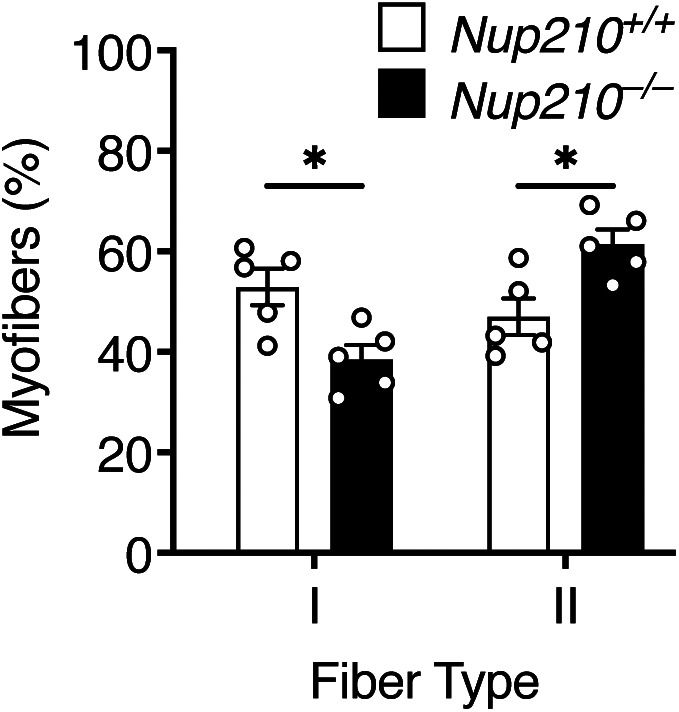
Figure S4. Quantification of fiber type distribution in soleus.

Quantification of fiber type distribution in soleus of 6- to 9-mo-old Nup210+/+ and Nup210−/− mice (n = 5). *P ≤ 0.05 by two-way ANOVA with Sidak’s multiple comparisons test.

Quantification of fiber type distribution in soleus of 6- to 9-mo-old Nup210+/+ and Nup210−/− mice (n = 5). *P ≤ 0.05 by two-way ANOVA with Sidak’s multiple comparisons test.