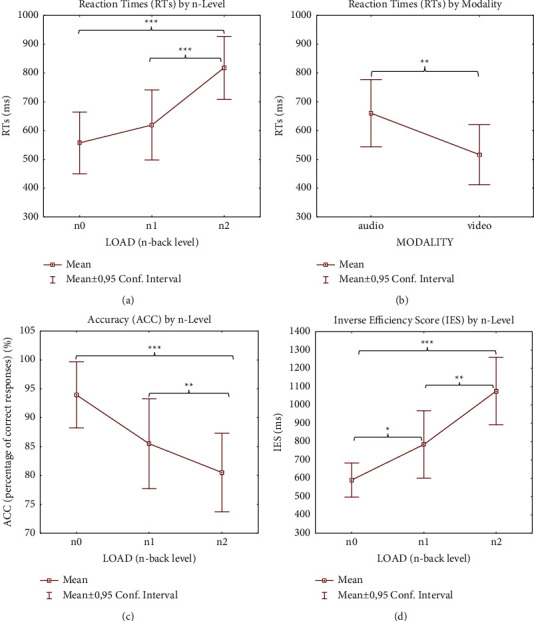
Figure 4.

Behavioral results. Significantly different ANOVA (see Tables 1 and 2) behavioral results (RT (a) and (b); ACC (c); IES-4 (d)) according to load and modality factors. Note. Significant differences between load condition, modality condition, and load x modality condition emerging from the post hoc test are indicated (∗p ≤ 0.05; ∗∗p ≤ 0.01; ∗∗∗p ≤ 0.001).
