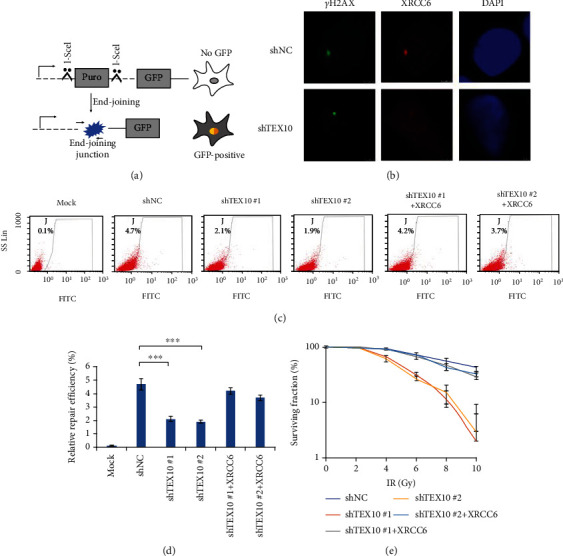
Figure 6.

TEX10 promotes NHEJ efficiency. (a) Diagram of NHEJ. Scissors indicate the cut sites of I-Sce I. The cut sites were cleaved after I-Sce I expression. GFP was expressed after NHEJ repair completion. (b) Fluorescent observation of DSB from T24 cells as suggested after I-Sce I expression. (c, d) Efficiency of the NHEJ repairs analyzed with flow cytometry. The percentage of GFP expression was regarded as repair completion for NHEJ repair tests. Shown is the mean ± SEM. ∗P < 0.05; ∗∗<0.01; ∗∗∗<0.001, Student's t-test. (e) T24 cells received the treatment by using increasing doses of IR and subjected to survival tests by CCK8 test. Shown is the mean ± SEM. ∗P < 0.05; ∗∗<0.01; ∗∗∗<0.001, Student's t-test.
