
Figure 2.
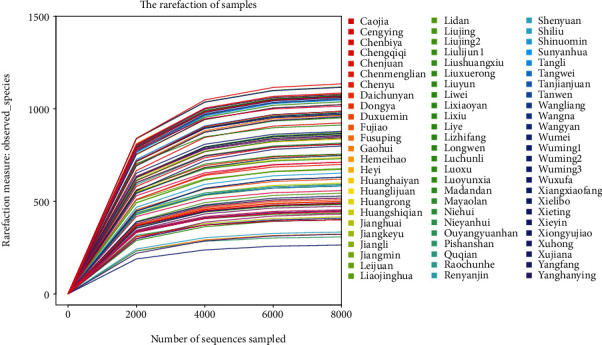
Dilution curve of each sample. The abscissa represents the number of sequences, and the ordinate represents the number of OTUs observed. According to the endpoint of the extension of the sample curve, the number of sequencing samples was found to correspond to the abscissa.