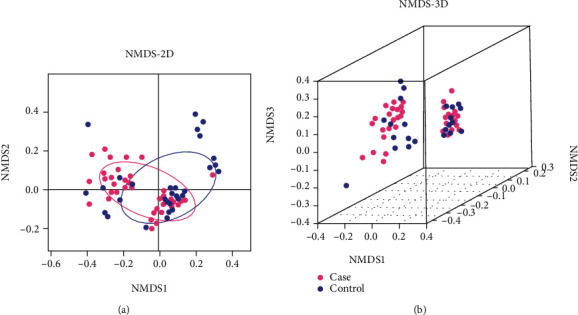
Figure 3.

The analysis of NMDS by 2D and 3D models. (a) Two-dimensional map. (b) Three-dimensional map. The different β-diversity distance matrices were compared and analyzed from the original data. The 2-dimensional and 3-dimensional maps of the sample space location were obtained. It indicates an obvious difference between the case and control groups when the same color samples are grouped by circle. Each dot represented one sample by pink (case group) or blue (control group) in the map. NMDS: nonmetric multidimensional scaling.
