
Figure 4.
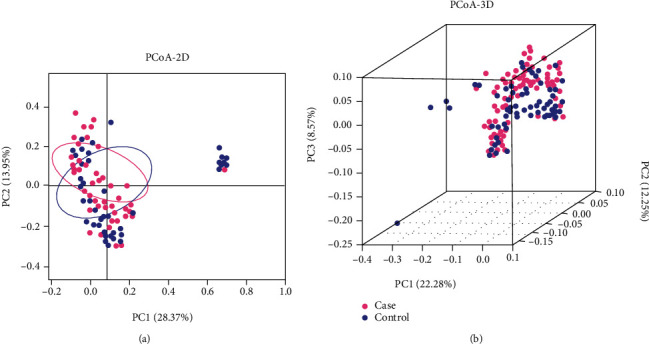
The analysis of PCoA by 2D and 3D models. (a) Two-dimensional map. (b) Three-dimensional map. PCoA map can be defined based on the distance matrix between samples to observe the differences of microbial populations between samples. If the abundance of the gut microbiota of the 2 samples is similar, the distance between the 2 points on the PCoA map will be closer. If the sample has good repeatability, the circle area is small; otherwise, the color area is large. Each dot represented one sample by pink (case group) or blue (control group) in the map. PCoA: principal coordinate analysis.