
Figure 9.
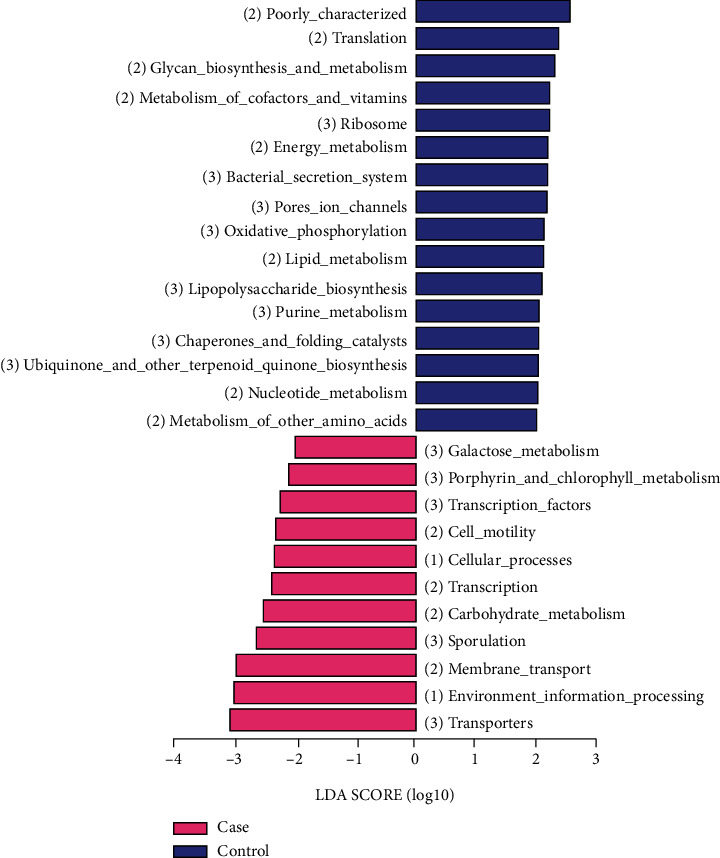
Screening of the differential functions using the KEGG pathway. The abundant signal pathways in the case group are represented by pink bars, and the abundant signal pathways in the control group are represented by blue bars.
Official websites use .gov
A
.gov website belongs to an official
government organization in the United States.
Secure .gov websites use HTTPS
A lock (
) or https:// means you've safely
connected to the .gov website. Share sensitive
information only on official, secure websites.
Screening of the differential functions using the KEGG pathway. The abundant signal pathways in the case group are represented by pink bars, and the abundant signal pathways in the control group are represented by blue bars.