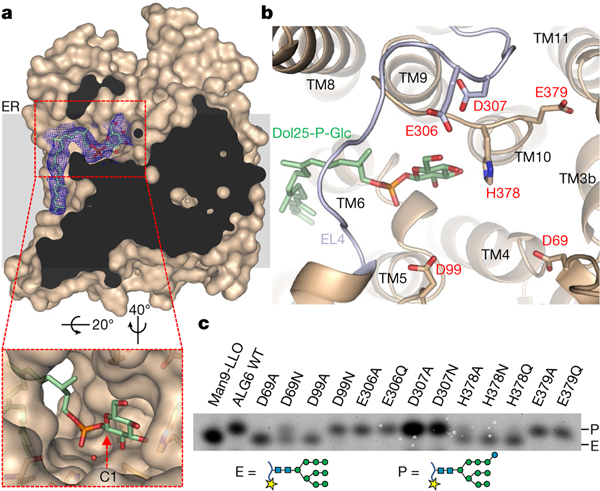
Fig. 4 |. Donor substrate binding and catalytic site of ALG6.
a, Surface representation of substrate-bound ALG6 in light brown with an EM density map for Dol25-P-Glc in the blue mesh carved to 3.0 Å, with bound Dol25-P-Glc in stick representation. The front of ALG6 was clipped for clarity. The inset shows a zoomed-in view. The red dashed arrow indicates the anomeric C1 of the glucose moiety. An ordered water molecule close to the C1 carbon is shown as a red sphere. b, Structure of the active site, with ALG6 shown in light brown ribbon representation with EL4 coloured in light blue. Acidic residues in the active site are shown in stick representation and labelled, and bound Dol25-P-Glc is depicted in stick representation, with carbon atoms coloured green. c, Analysis of substrate conversion by ALG6 variants, with mutations indicated above the lanes. WT, wild type.

