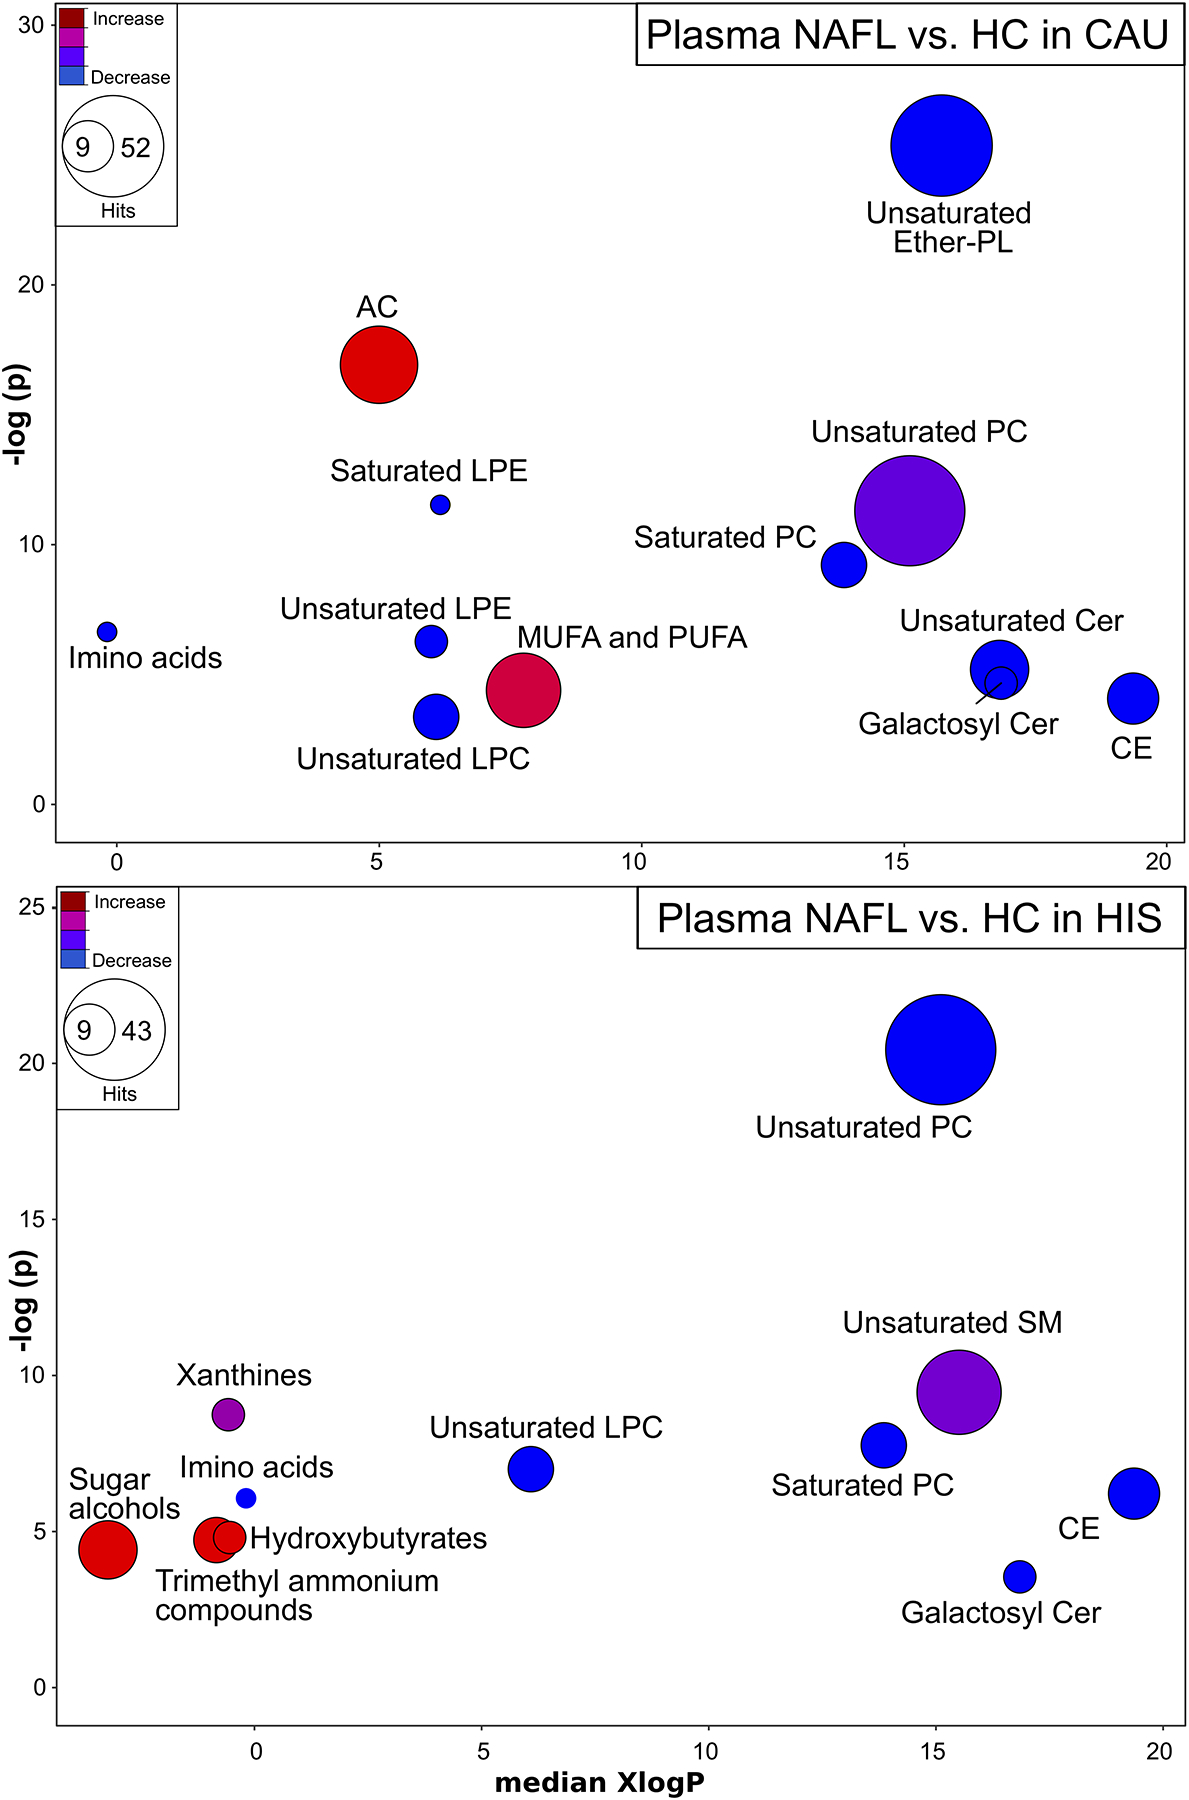
Fig 1. Plasma metabolites altered by chemical class in NAFL, compared to HC in both ethnicities.

Chemical similarity enrichment analysis (ChemRICH) and enrichment statistics plot for NAFL vs. HC in CAU (top panel) and HIS (bottom panel). Each cluster represents altered chemical class of metabolites (p <0.05). Cluster sizes represent the total number of metabolites. Cluster’s color represents the directionality of metabolite differences: red – higher in NAFL; blue – lower in NAFL. Colors in between refer to mixed population of metabolites manifesting both higher and lower levels in NAFL when compared to the control. The x-axis represents the cluster order on the chemical similarity tree. The plot y-axis shows chemical enrichment p-values calculated using Kolmogorov–Smirnov test. Only clusters with p <0.05 are shown. FDR-adjustment q =0.2, and clusters with FDR-adjusted p ≥0.2 are shown in gray. (n, NAFL-HIS =7, HC-HIS =14; NAFL-CAU =8, HC-CAU =8). The detailed ChemRICH results are shown in (Table S1 and S2). AC, Acylcarnitines; CAU, White Caucasian; Cer, Ceramides; CE, Cholesteryl ester; DG, Diglycerides; Ether-PL, Ether-linked phospholipids; HIS, Hispanic; LPC, Lysophosphatidylcholine; LPE, Lysophosphatidylethanolamines; MUFA, Monounsaturated fatty acid; PC, Phosphatidylcholines; PUFA, Polyunsaturated fatty acids; SFA, Saturated fatty acids; SM, Sphingomyelins; NAFL, Steatosis; TG, Triglycerides.
