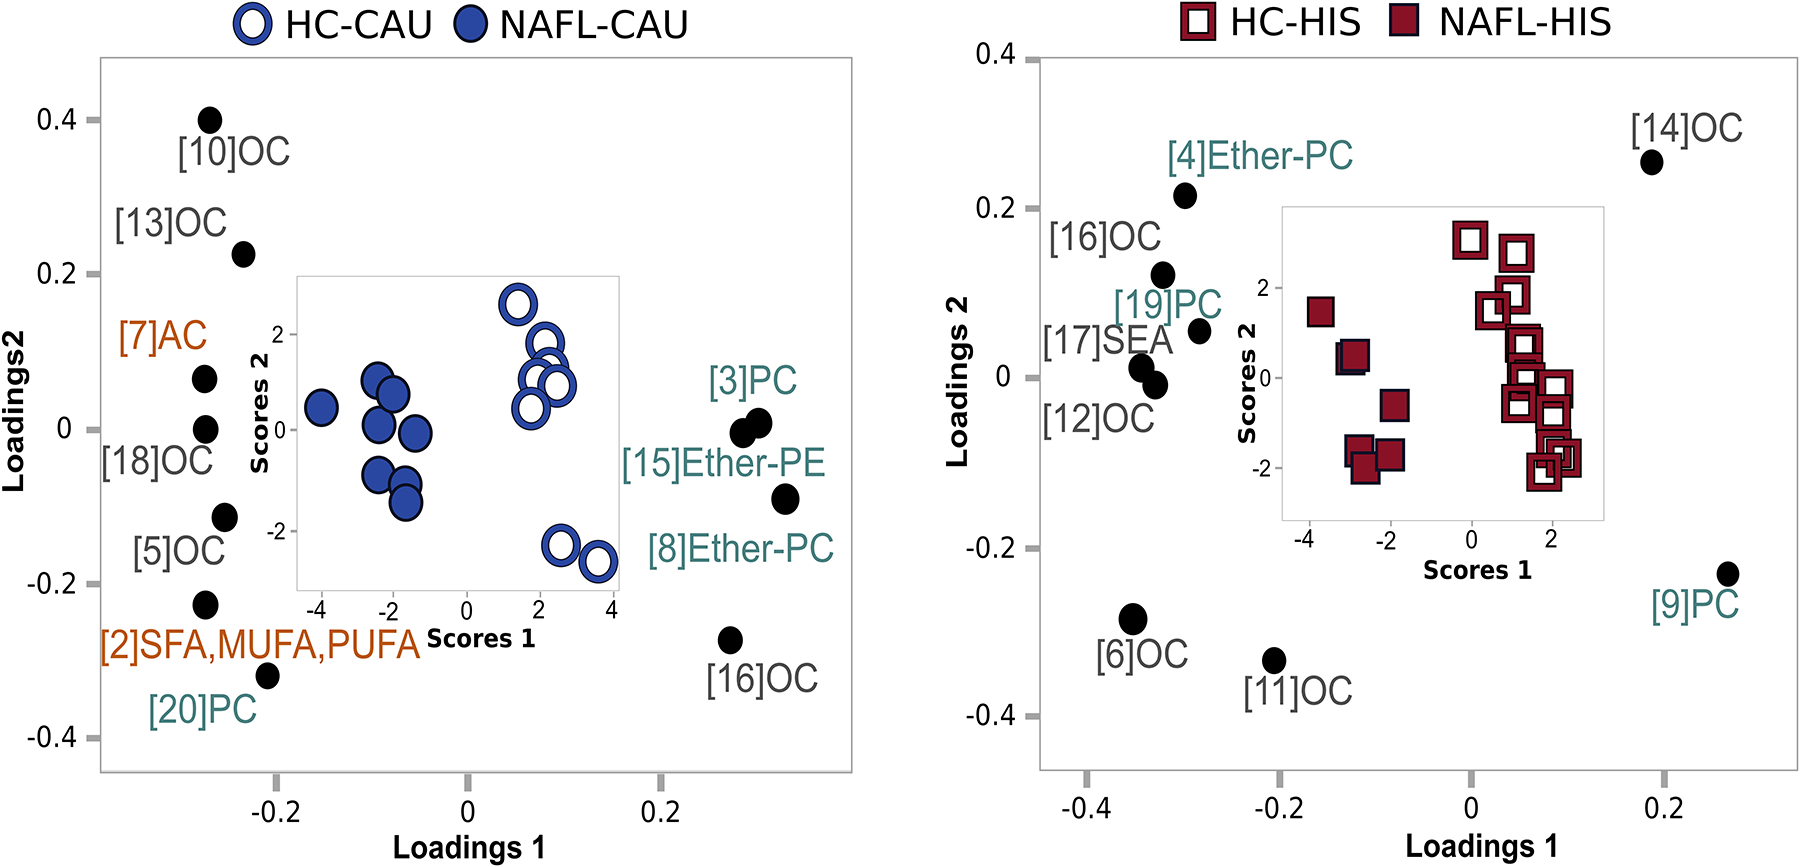
Fig 2. Supervised clustering model illustrating potential ethnicity-specific variations in plasma observed between NAFL vs. HC in both ethnicities.

Metabolites with p <0.1 for interaction (ethnicity x NAFL) from ANCOVA were clustered and cluster components were subjected to partial least square-discriminant analysis (PLS-DA) separately in each ethnicity. Only clusters of variable importance in projection (VIP)>1 are illustrated. A combined loading and score plot for a) NAFL-CAU vs. HC-CAU; b) NAFL-HIS vs. HC-HIS. The model was validated with leave-one-out cross validation (LOOCV). The (Q2), (R2X) and (R2Y) is 0.817, 0.285 and 0.918; 0.816, 0.204 and 0.911 for CAU and HIS, respectively. The details on metabolites and clusters components are shown in (Table S3). AC, Acylcarnitines; CAU, White Caucasian; Ether-PC, Ether-linked phosphatidylcholines; Ether-PE, Ether-linked phosphatidylethanolamines; HC, Healthy control; HIS, Hispanic; MUFA, Monounsaturated fatty acid; OC, Organic compounds; PC, Phosphatidylcholines; PUFA, Polyunsaturated fatty acids; NAFL, Steatosis; SEA, Stearoyl ethanolamine; SFA, Saturated fatty acids.
