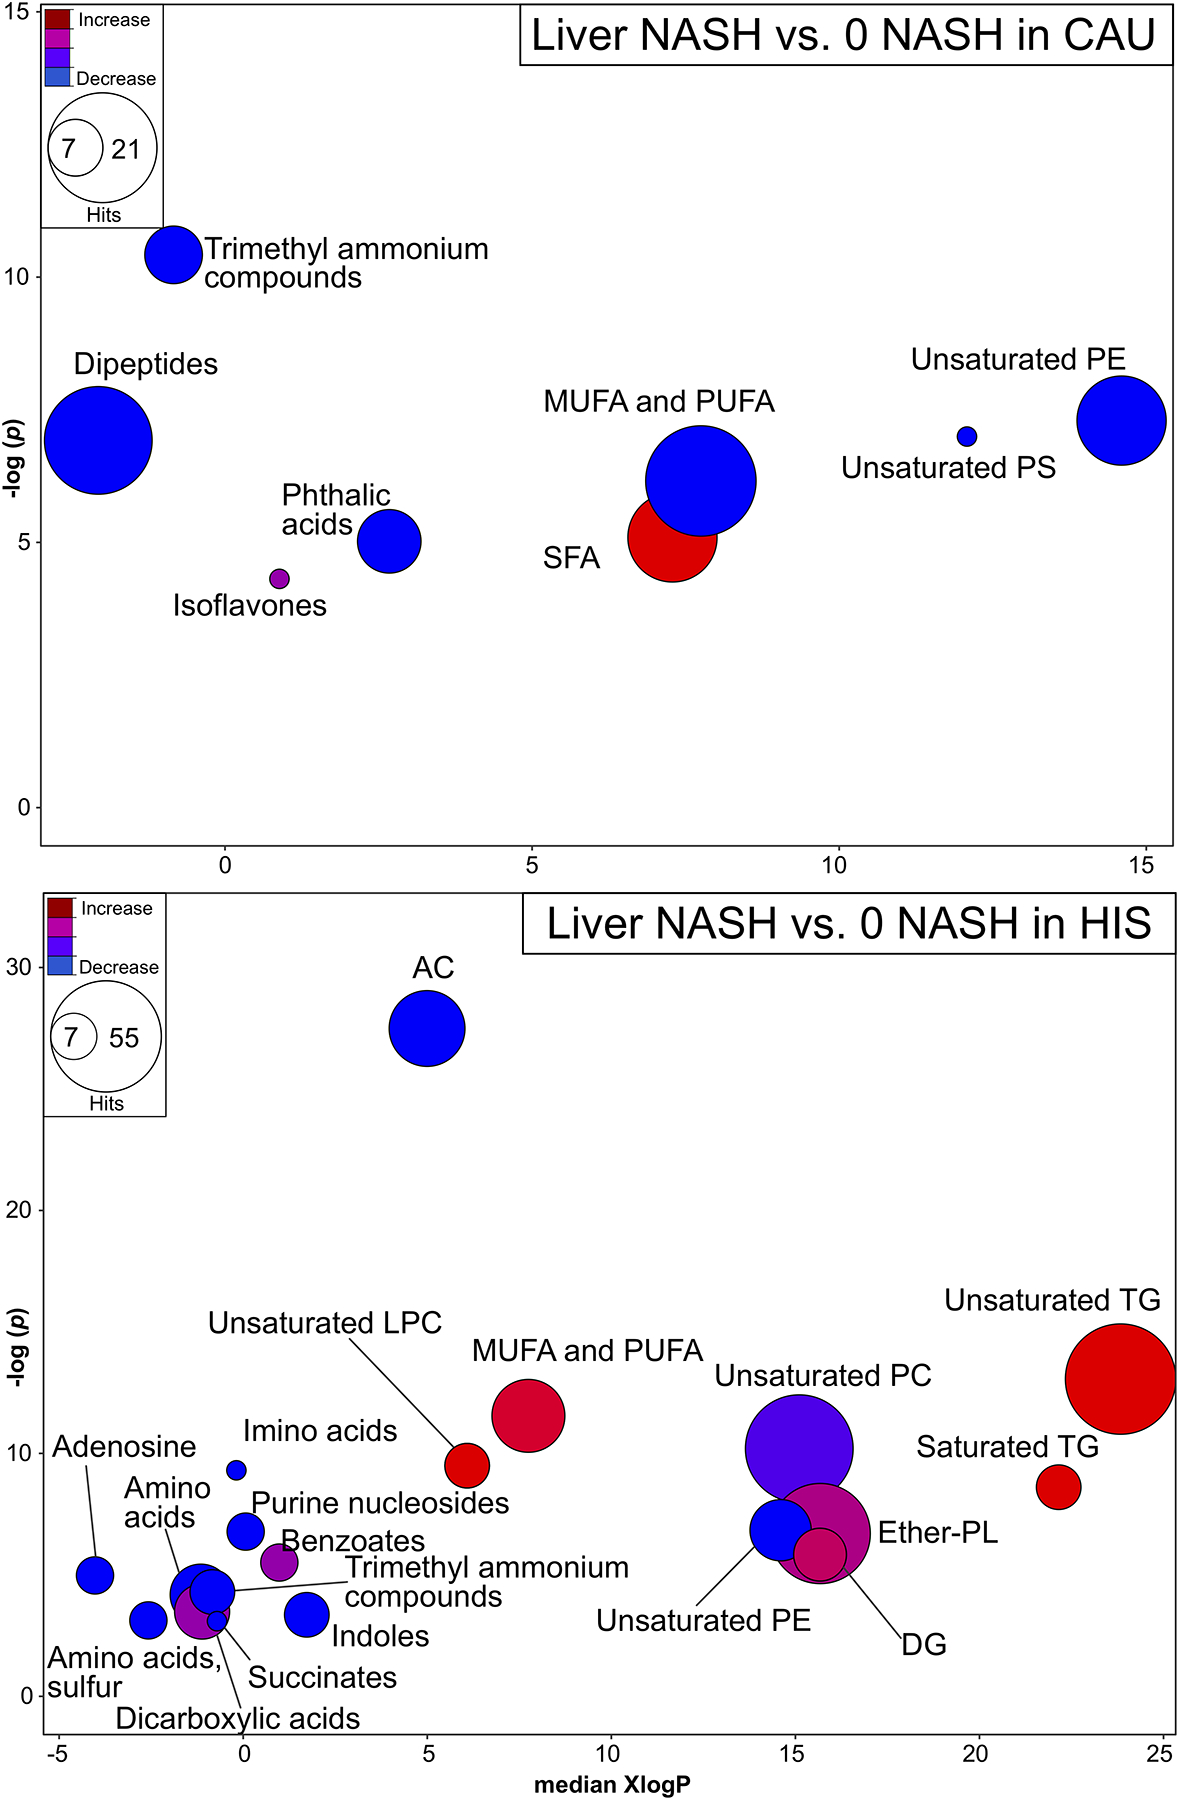
Fig 4. Liver metabolites altered by chemical class in NASH, compared to NASH -free subjects, in both ethnicities.

Chemical similarity enrichment analysis (ChemRICH) illustrating hepatic metabolite class altered in NASH compared to 0-NASH in both ethnicities. ChemRICH enrichment statistics plot, illustrating liver alterations in NASH vs. 0-NASH in CAU (top panel) and HIS (bottom panel). Each cluster represents altered chemical class of metabolites (p <0.05). Cluster sizes represent the total number of metabolites. Cluster’s color represents the directionality of metabolite differences: red – higher in NASH; blue – lower in NASH. Colors in between refer to mixed population of metabolites manifesting both higher and lower levels in NASH when compared to the 0-NASH. The x-axis represents the cluster order on the chemical similarity tree. The plot y-axis shows chemical enrichment p-values calculated using Kolmogorov–Smirnov test. Only clusters with p <0.05 are shown. FDR-adjustment q =0.2, and clusters with FDR-adjusted p ≥0.2 are shown in gray. (n, 0 NASH-HIS =4, NASH-HIS =3; 0 NASH-CAU =5, NASH-CAU =5). The detailed ChemRICH results are shown in (Table S6 and S7). AC, Acylcarnitines; CAU, White Caucasian; Cer, Ceramides; CE, Cholesteryl ester; DG, Diglycerides; Ether-PL, Ether-linked phospholipids; HIS, Hispanic; LPC, Lysophosphatidylethanolamines; MUFA, Monounsaturated fatty acid; NASH, Nonalcoholic steatohepatitis; 0-NASH, Nonalcoholic steatohepatitis-free; PC, Phosphatidylecholine; PE, Phosphatidylethanolamine; PUFA, Polyunsaturated fatty acids; SFA, Saturated fatty acids; TG, Triglycerides.
