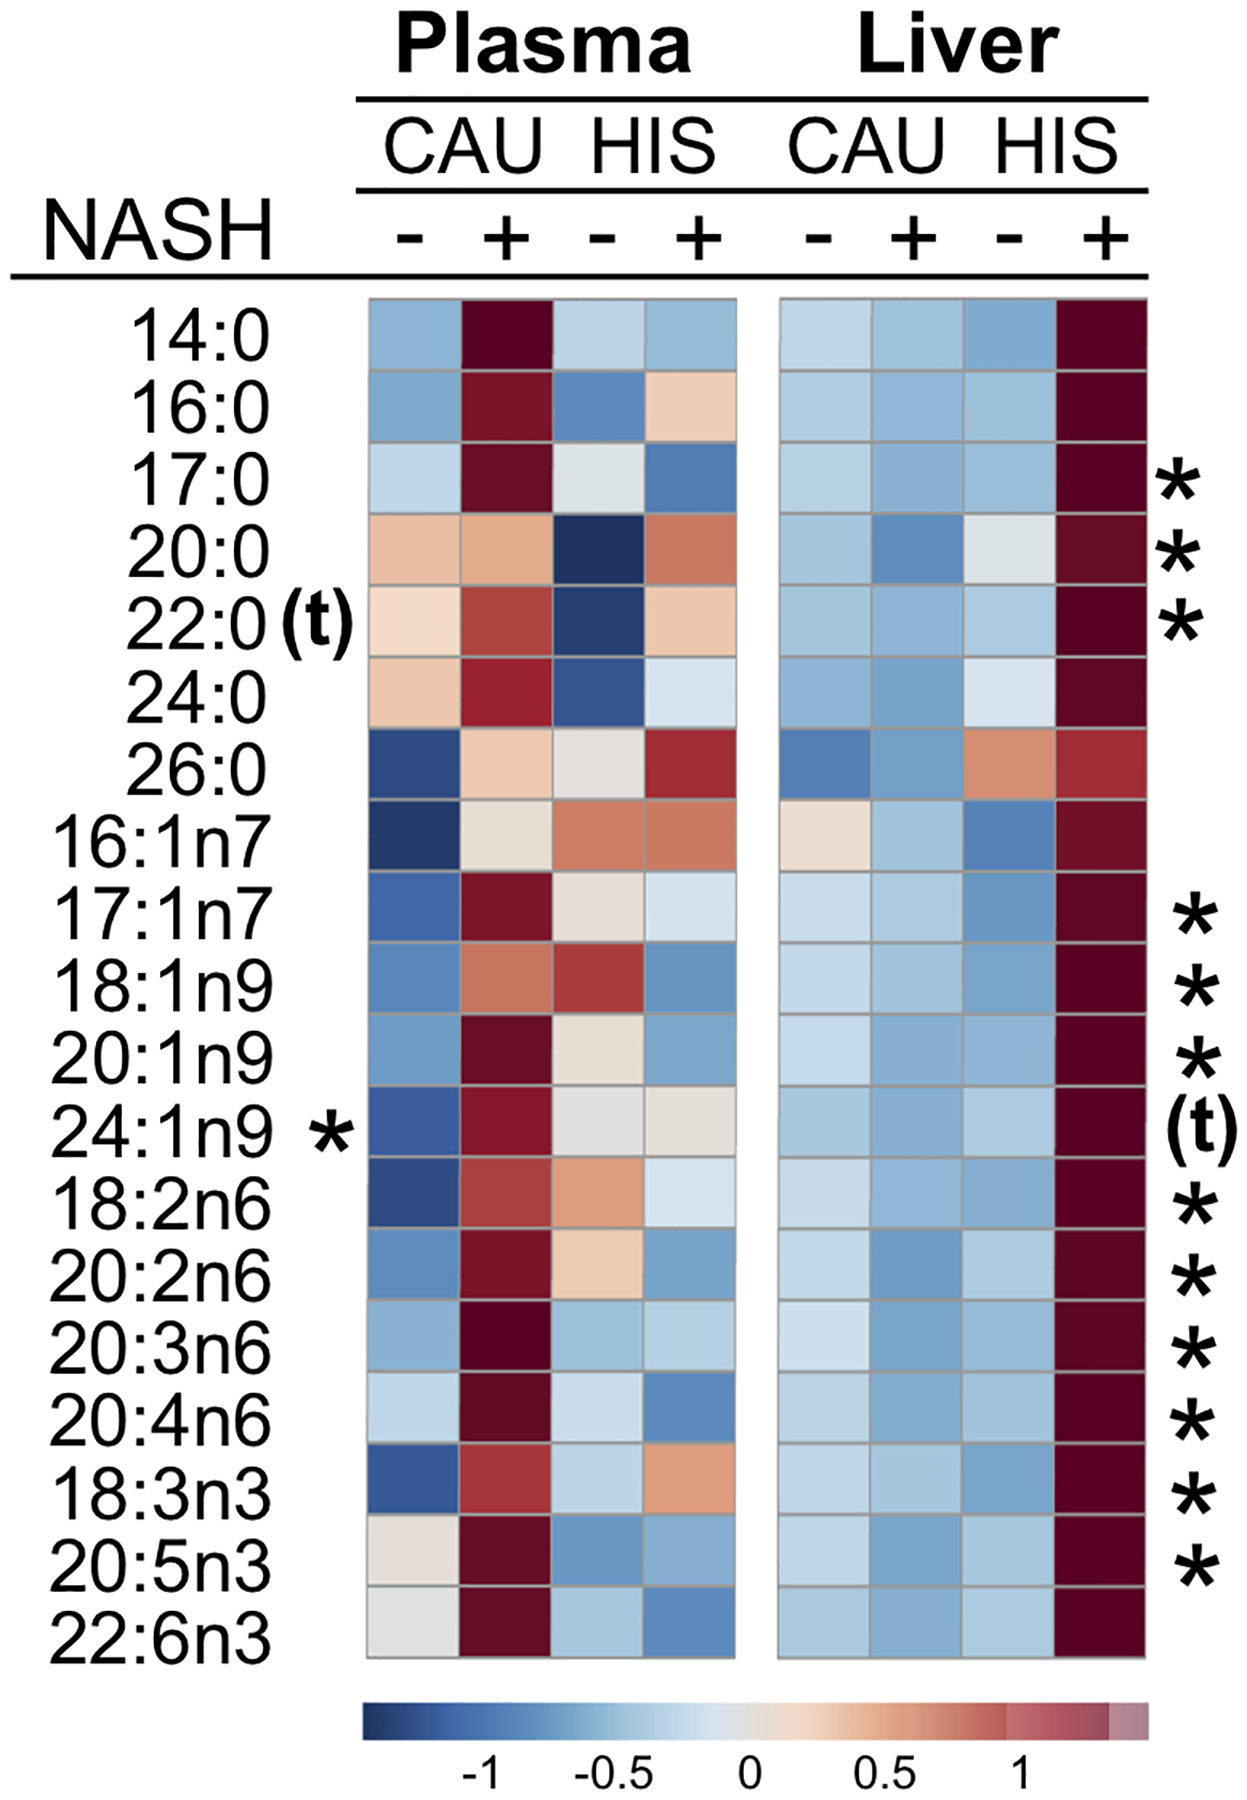
Fig 6. Heat-map for plasma and liver free fatty acids with fold change and p-values in NASH vs. 0 NASH in both ethnicities.

Group means are shown with normalized data converted to z-scores. Fatty acids showing ethnicity-related differences (p <0.05 on interaction NASH x ethnicity) in are denoted by (*), and with tendency for interaction (p =0.05 to <0.1) are denoted with (t). Mean direction of change is indicated by color and intensity, with red representing increased values, and blue representing decreased values. CAU, White Caucasian; HIS, Hispanics; NASH, Nonalcoholic steatohepatitis.
