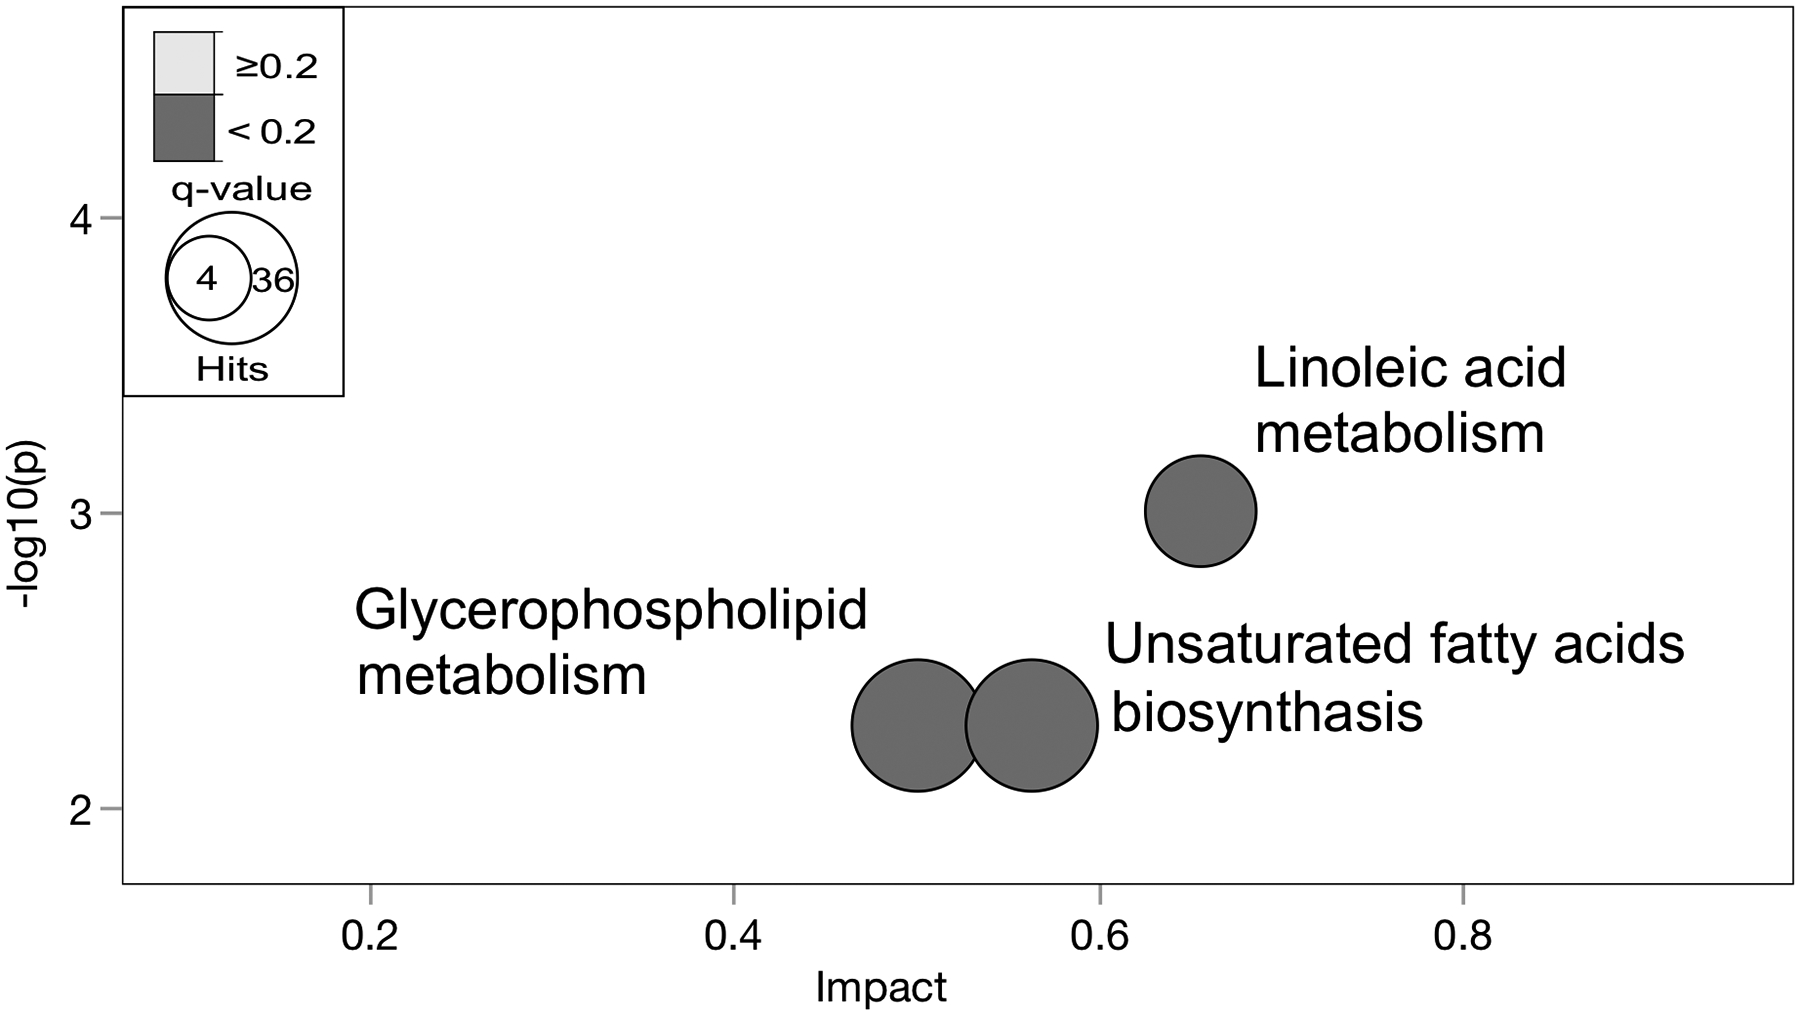
Fig 7. Hepatic metabolic pathways differentially altered with NAHS between ethnicities.

Metabolites with differential alterations between ethnicity in NASH (p <0.05) were compared against pathway-associated metabolites sets from Kyoto Encyclopedia of Genes and Genomes (KEGG) [46]. Metabolic pathways significantly altered are shown as nodes. The (y-axis) represents the p-values as determined by Fisher’s Exact test. The (x-axis) represents the impact of pathways as determined by the relative betweenness centrality-topology analysis. The size of the node represents the total hit number of hits. (n, 0 NASH-HIS=4, NASH-HIS=3; 0 NASH-CAU=5, NASH-CAU=5). Detailed pathway analysis statistics are shown in (Table S9).
