
Fig 9. Ethnicity-related differences in plasma metabolomic profile in NASH vs. 0-NASH.
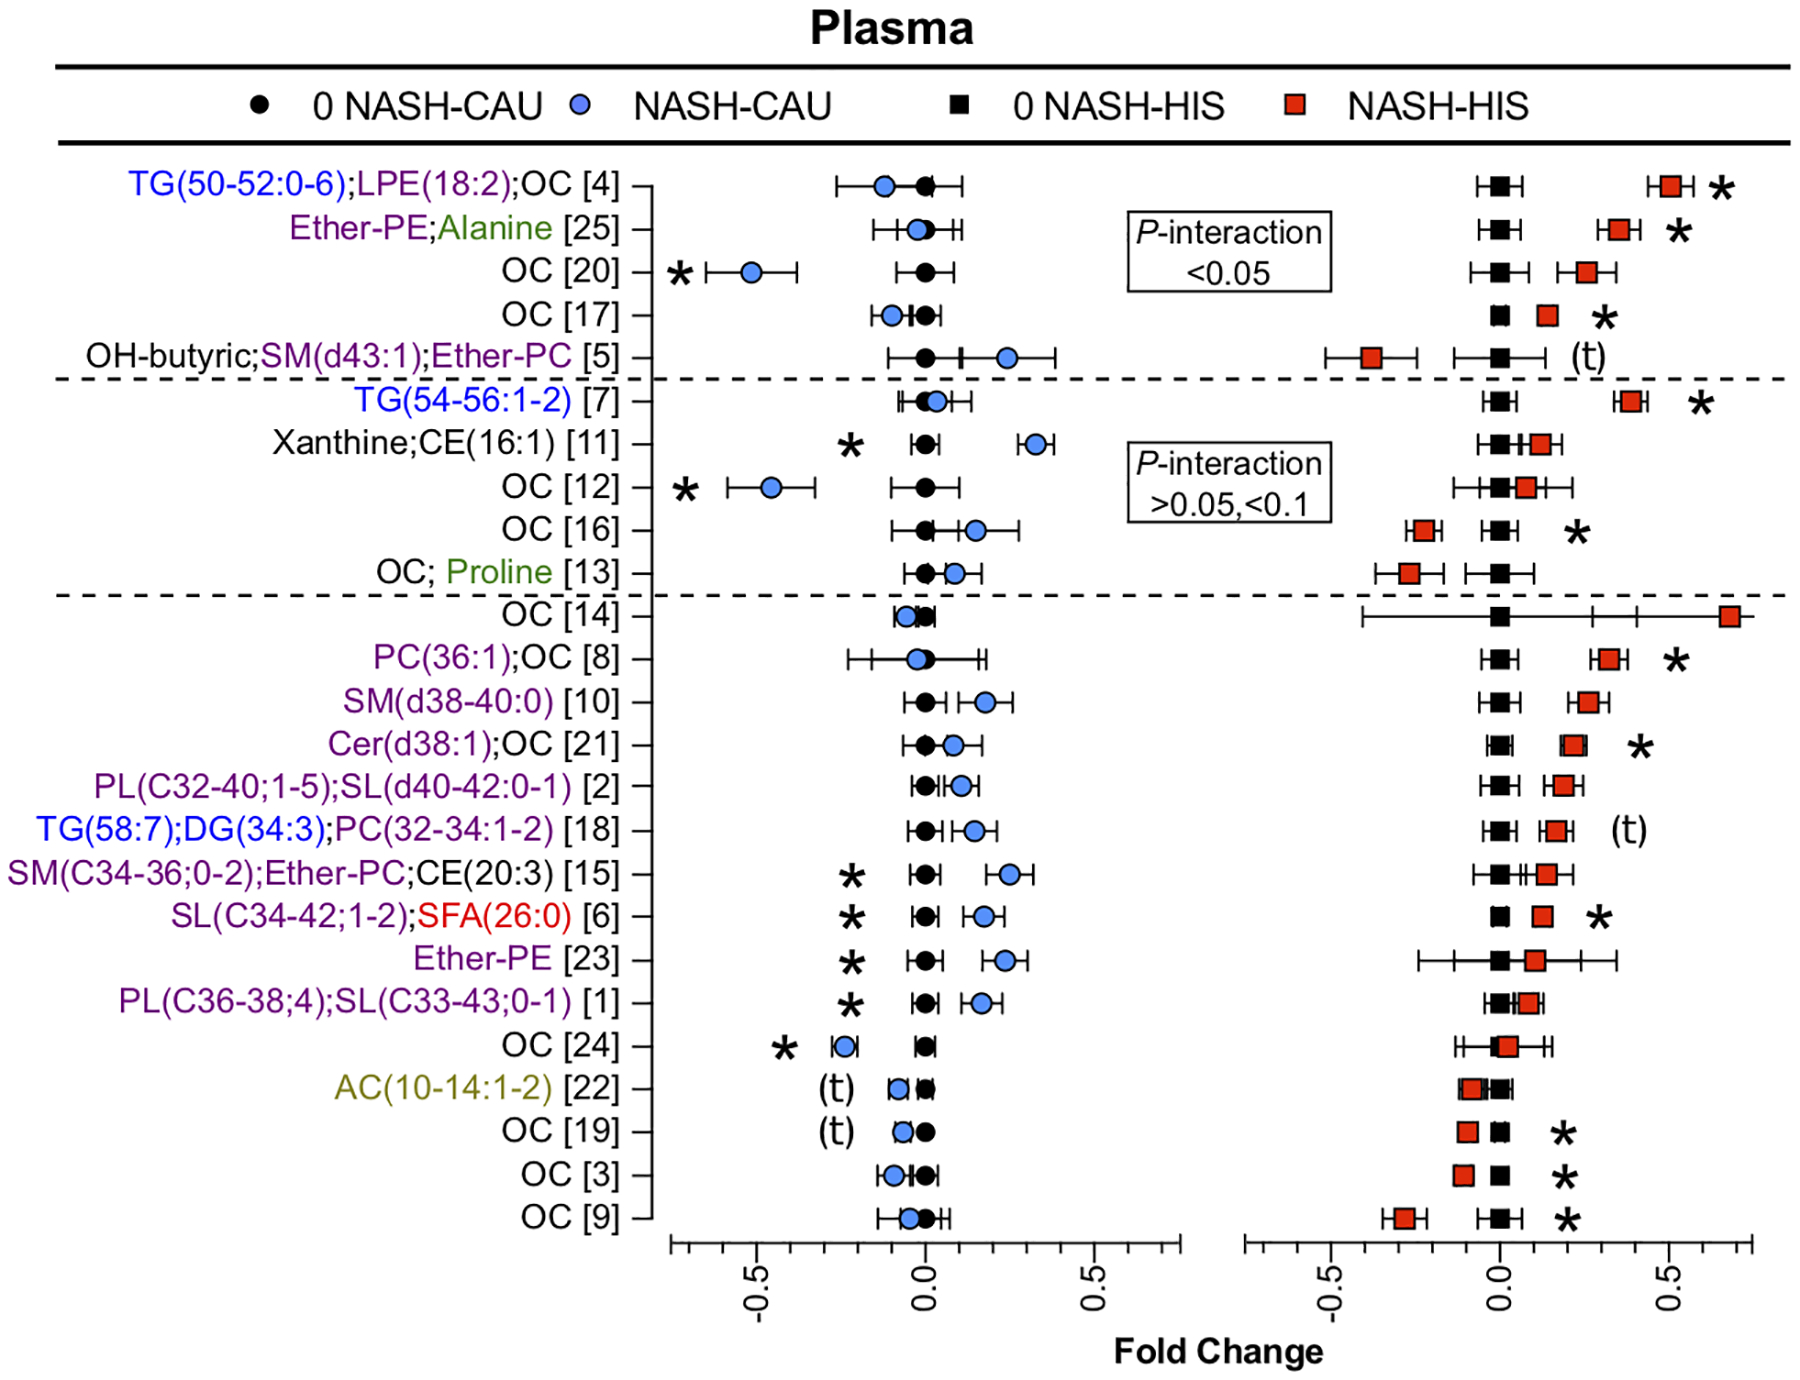
Results of t-test and ANCOVA (ethnicity x NASH) interaction comparison performed on plasma variable cluster components between NASH and 0-NASH in both ethnicities. Clustering was performed on metabolites that were different (p <0.05) within groups (NASH vs. 0-NASH) or between ethnicity groups (interaction (NASH x ethnicity)). Data are presented as the fold change from 0-NASH; error bars represent standard error. Metabolite clusters are ranked in order of p-value for (interaction (NASH x ethnicity) and labeled by a number and a description of representative metabolite. For complex lipids, lipid class is followed by number of (carbons, double bounds) of the fatty acyl moiety. Clusters showing ethnicity-related differences in NASH (p <0.05) or tendency for interaction (p=0.05 to <0.1) are marked with the dashed line. Clusters affected by NASH within ethnicity (p <0.05) are denoted with (*); clusters with tendency (p=0.05 to <0.1) are denoted with (t). (n, 0 NASH-HIS=4, NASH-HIS=3; 0 NASH-CAU=5, NASH-CAU=3). The details on metabolites and clusters components are shown in (Table S12). AC, Acylcarnitines; CAU, White Caucasian; CE, cholesteryl ester; DG, diglycerides; Ether-PC, Ether-linked phosphatidylcholines; Ether-PE, Ether-linked phosphatidylethanolamines; HIS, Hispanic; MUFA, Monounsaturated fatty acid; NASH, Nonalcoholic steatohepatitis; 0-NASH, Nonalcoholic steatohepatitis-free; OC, Organic compounds; PC, Phosphatidylcholines; PL, Phospholipids; PUFA, Polyunsaturated fatty acids; NAFL, Steatosis; SFA, Saturated fatty acids; SM, sphingomyelins; TG, triglycerides.