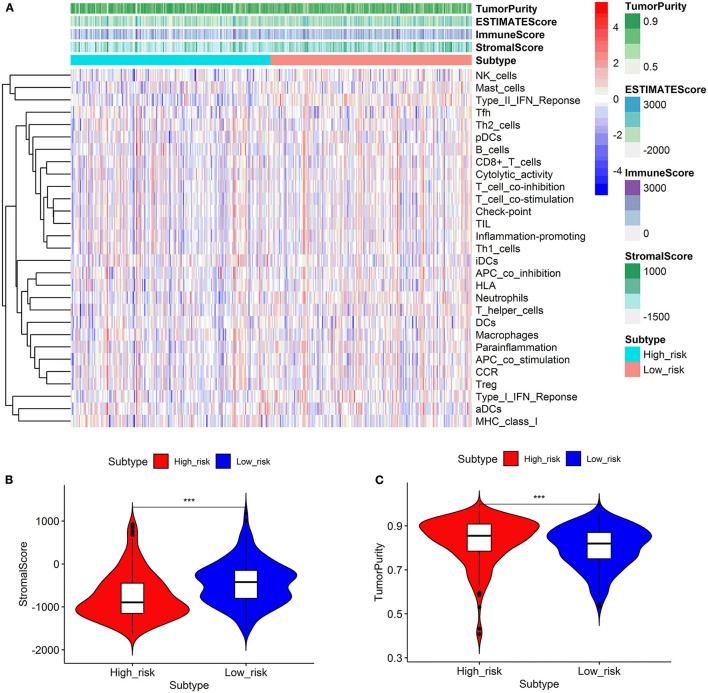
Figure 6.
Comparison of the immune activity and tumor microenvironment between high- and low-risk groups. Hierarchical clustering showed that the low-risk group exhibited more immune cell infiltration than the high-risk group (A). Comparison of stromal scores between the high- and low-risk groups (B). Comparison of the tumor purity between high- and low-risk groups (C). ***p < 0.001.

