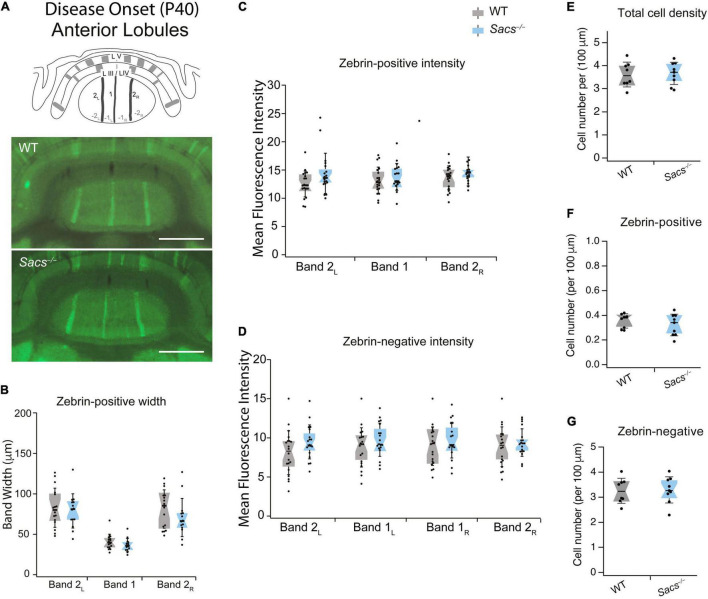
FIGURE 1.
Anterior vermis zebrin expression is unaltered in disease-onset (P40) Sacs–/–mice. (A) Schematic (top) illustrates a coronal view of anterior lobules (L) and zebrin bands. Measurements were taken from anterior lobule III/IV at P40. Representative images show anterior zebrin expression (green) in WT (middle) and Sacs–/– mice (bottom). (B) The widths of the zebrin-positive bands in the anterior lobule were not significantly different in Sacs–/– cerebellum (blue) compared to WT (gray). (C,D) Similarly, there were no significant differences observed between the mean fluorescence intensity (arbitrary fluorescence units, a.u.) of (C) zebrin-positive bands (D) or zebrin-negative bands in WT (gray) and Sacs–/– (blue) cerebellar vermis. (E–G) No significant reduction was observed in the total density of Purkinje cells in anterior lobules [(E) shown as the number of cells per μm]. We also observed no differences in zebrin-positive (F) and zebrin-negative (G) cell densities. No significant differences were observed for any comparisons. N = 4 for both WT and Sacs–/– mice, two sections per animal; see Table 2 for P-values; Student’s t-test, P > 0.05 when no comparison is shown. Scale bar, 1 mm. WT, wildtype.

