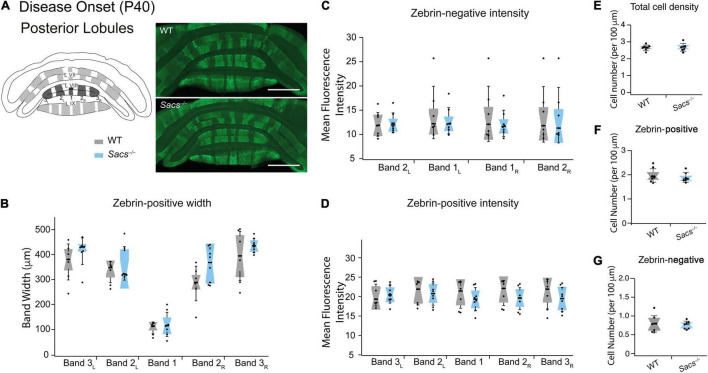
FIGURE 2.
Posterior vermis zebrin expression is unaltered in disease-onset (P40) Sacs–/–mice. (A) Schematic (left) illustrates the coronal view of posterior lobules (L) and zebrin bands. Measurements were taken from posterior lobules VIII and IX. Sample images (right) show posterior zebrin expression in WT (top) and Sacs–/– mice (bottom). (B) The widths of the zebrin-positive bands in the posterior lobules were not significantly different between WT (gray) and Sacs–/– cerebellum (blue). (C,D) Similarly, there were no significant differences observed between the mean fluorescence intensity (arbitrary fluorescence units, a.u.) of (C) zebrin-positive, or (D) zebrin-negative bands in WT (gray) and Sacs–/– (blue) cerebellar vermis. (N = 6 for both WT and Sacs–/– mice. (E–G) There was no significant change in the total number of Purkinje cells of the posterior lobules [(E) the number of cells per 100 μm]. We also observed no differences in zebrin-positive (F) and zebrin-negative (G) cell densities. N = 4 for WT; N = 4 for Sacs–/–, two sections per animal; see Table 3 for P-values; Student’s t-test, P > 0.05 when no comparison is shown. Scale bar, 1 mm.

