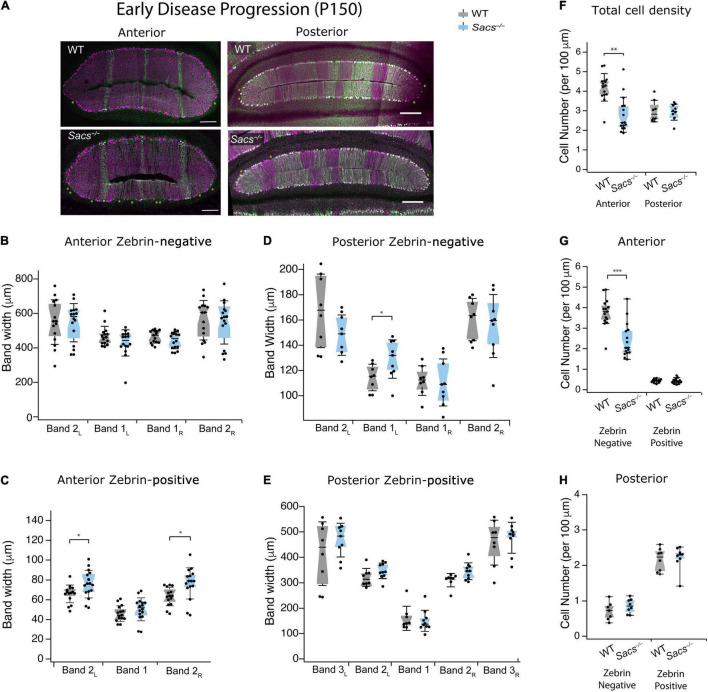
FIGURE 3.
Purkinje cell death occurs primarily in zebrin-negative cells in the anterior vermis at P150. (A) Representative images of anterior lobules (left) and posterior lobules (right), from WT (top) and Sacs–/– (bottom) from a P150 mouse with Purkinje cells labeled with calbindin (purple) and zebrin (green). (B) The widths of the zebrin-negative bands in the anterior lobule were not significantly different in Sacs–/– cerebellum (blue) compared to WT (gray). (C) However, the widths of two of the zebrin-positive bands in the anterior lobule were significantly higher in Sacs–/– cerebellum (blue) compared to WT (gray) (N = 7 for WT; N = 8 for Sacs–/–, 2 images per animal per lobule; Mann Whitney U test *P < 0.05). (D) The width of one zebrin-negative band was elevated in Sacs–/– mice compared to WT (Band 1L). (E) The widths of zebrin-positive bands in posterior lobules were not significantly different in Sacs–/– cerebellum (blue) compared to WT (gray). (F–H) Total Purkinje cell density (number of cells per 100 μm) from anterior (left) and posterior (right) lobules were calculated. A significant reduction was observed in Purkinje cell density in the anterior (left), but not posterior (right) lobules at this age (F), in line with previous reports (Lariviere et al., 2015). (G) We observed a significant reduction in the zebrin-negative (left) but not zebrin-positive (right) Purkinje cell density only anterior lobules in Sacs–/– mice compared to WT, while (H) neither were significantly affected in posterior lobules. (N = 7 for WT; N = 8 for Sacs–/–, 2 sections per lobule per animal; see Tables 2, 3 for P-values; Student’s t-test *P < 0.05, **P < 0.005, P > 0.05 when no comparison is shown, Scale bar, 200 μm.

