
Figure 4. Odds of composite CRT response.
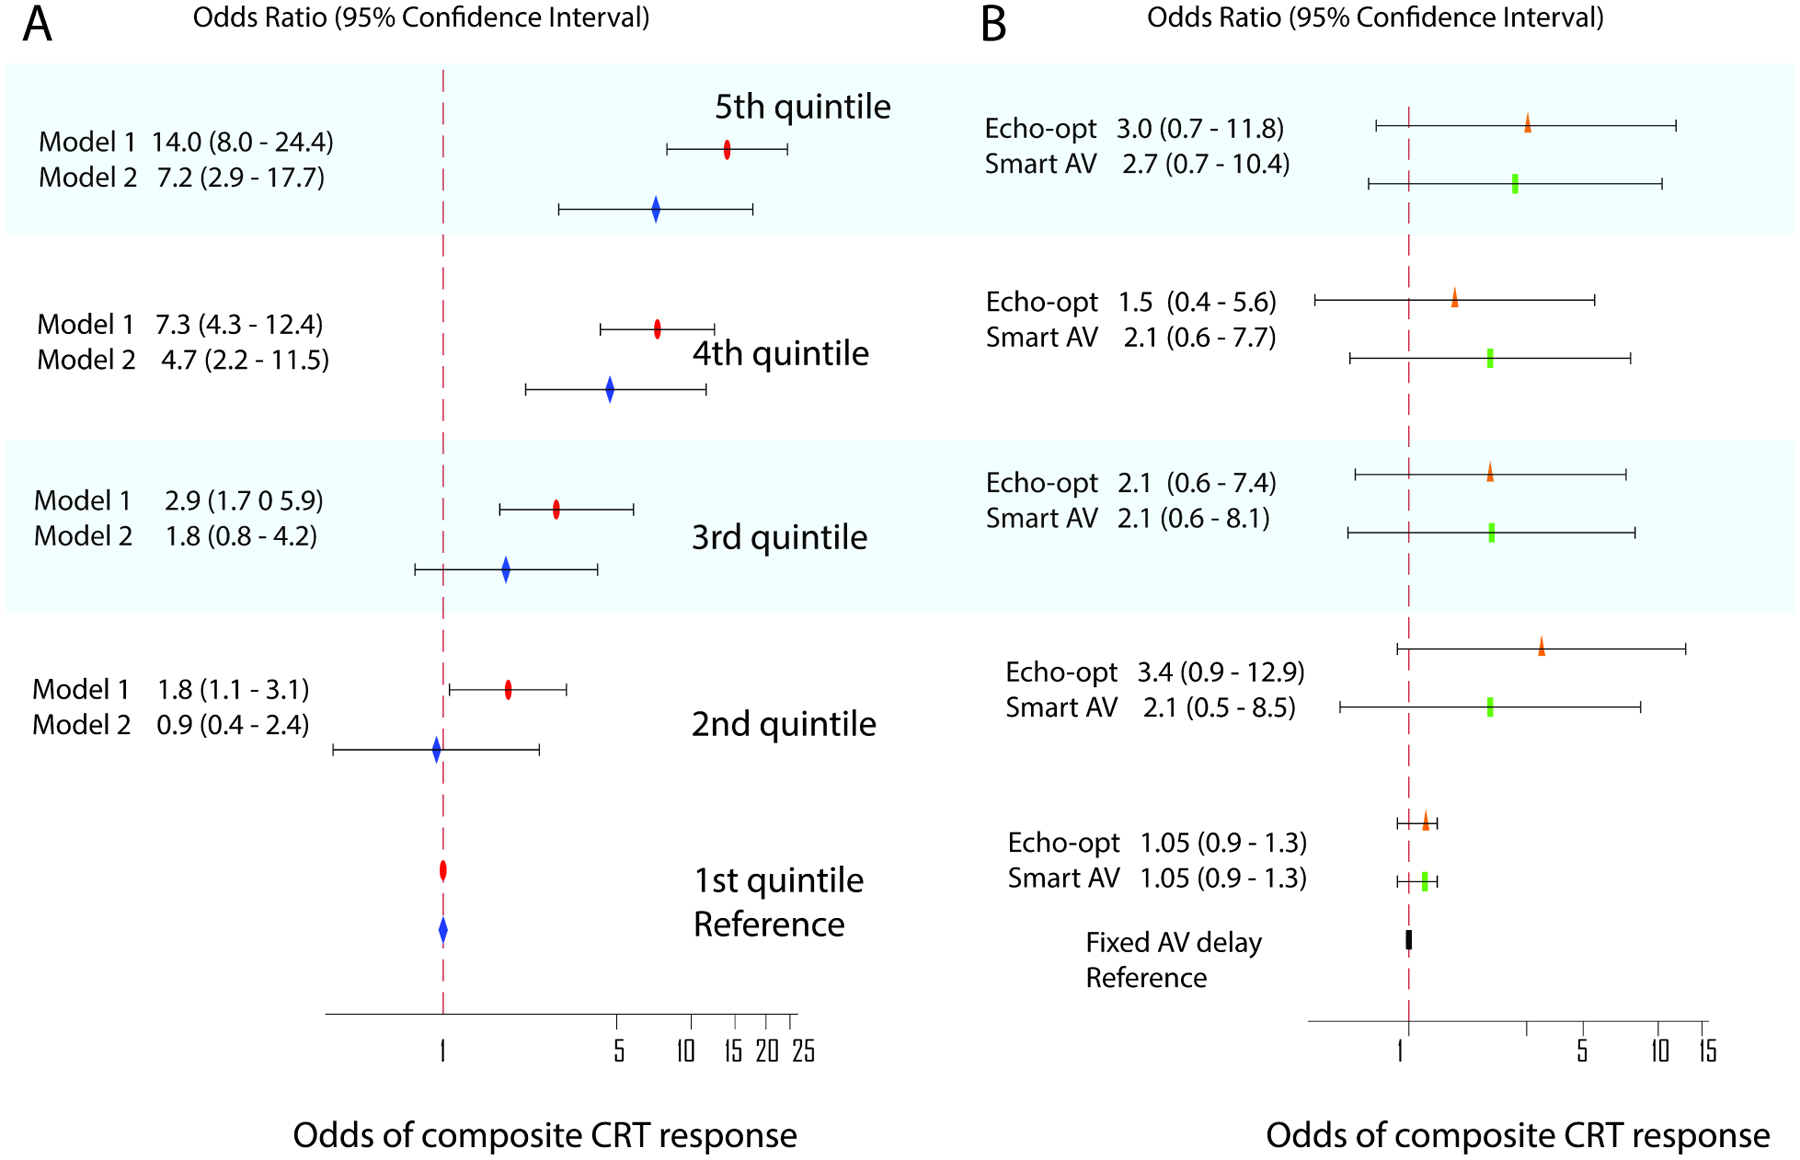
Probabilities of composite CRT response by quintiles of the adaptive lasso model. The 1st quintile is a reference. A. Unadjusted (model 1, red ovals) and adjusted by the ITT AV-delay optimization assignment (model 2, blue diamonds). B. Relative odds of composite CRT response in SMART-AV participants randomized to echo-optimized AV delay (orange triangles) and Smart-AV-delay algorithm (green rectangles). Fixed AV delay group was a reference. Black lines correspond to 95% CI bounds.