
Figure 3.
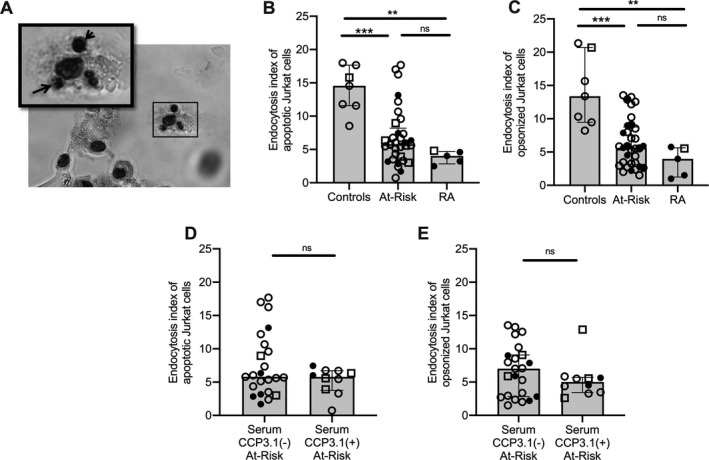
Sputum macrophage endocytosis of apoptotic and opsonized cells. A, Representative image of macrophage efferocytosis assay displaying ingestion of apoptotic Jurkat cells (arrows) by a sputum macrophage. Original magnification × 400. B and C, Endocytosis index of apoptotic (B) and opsonized (C) Jurkat cells in healthy controls (n = 7), subjects at risk for RA (n = 33), and RA patients (n = 5). D and E, Endocytosis index of apoptotic (D) and opsonized (E) Jurkat cells in at‐risk subjects with serum negative for anti–citrullinated protein antibodies (ACPA) (n = 23) and those with serum positive for ACPA (n = 10), with ACPA measured using an anti‐CCP3.1 (IgG/IgA) enzyme‐linked immunosorbent assay. Median levels were compared between groups using Wilcoxon’s rank sum test. Bars show the median and interquartile range. Open circles represent subjects negative for sputum IgA anti‐CCP, solid circles represent subjects positive for sputum IgA anti‐CCP, and open squares represent subjects in whom sputum IgA anti‐CCP was not tested. ** = P < 0.01; *** = P < 0.001. See Figure 1 for other definitions.