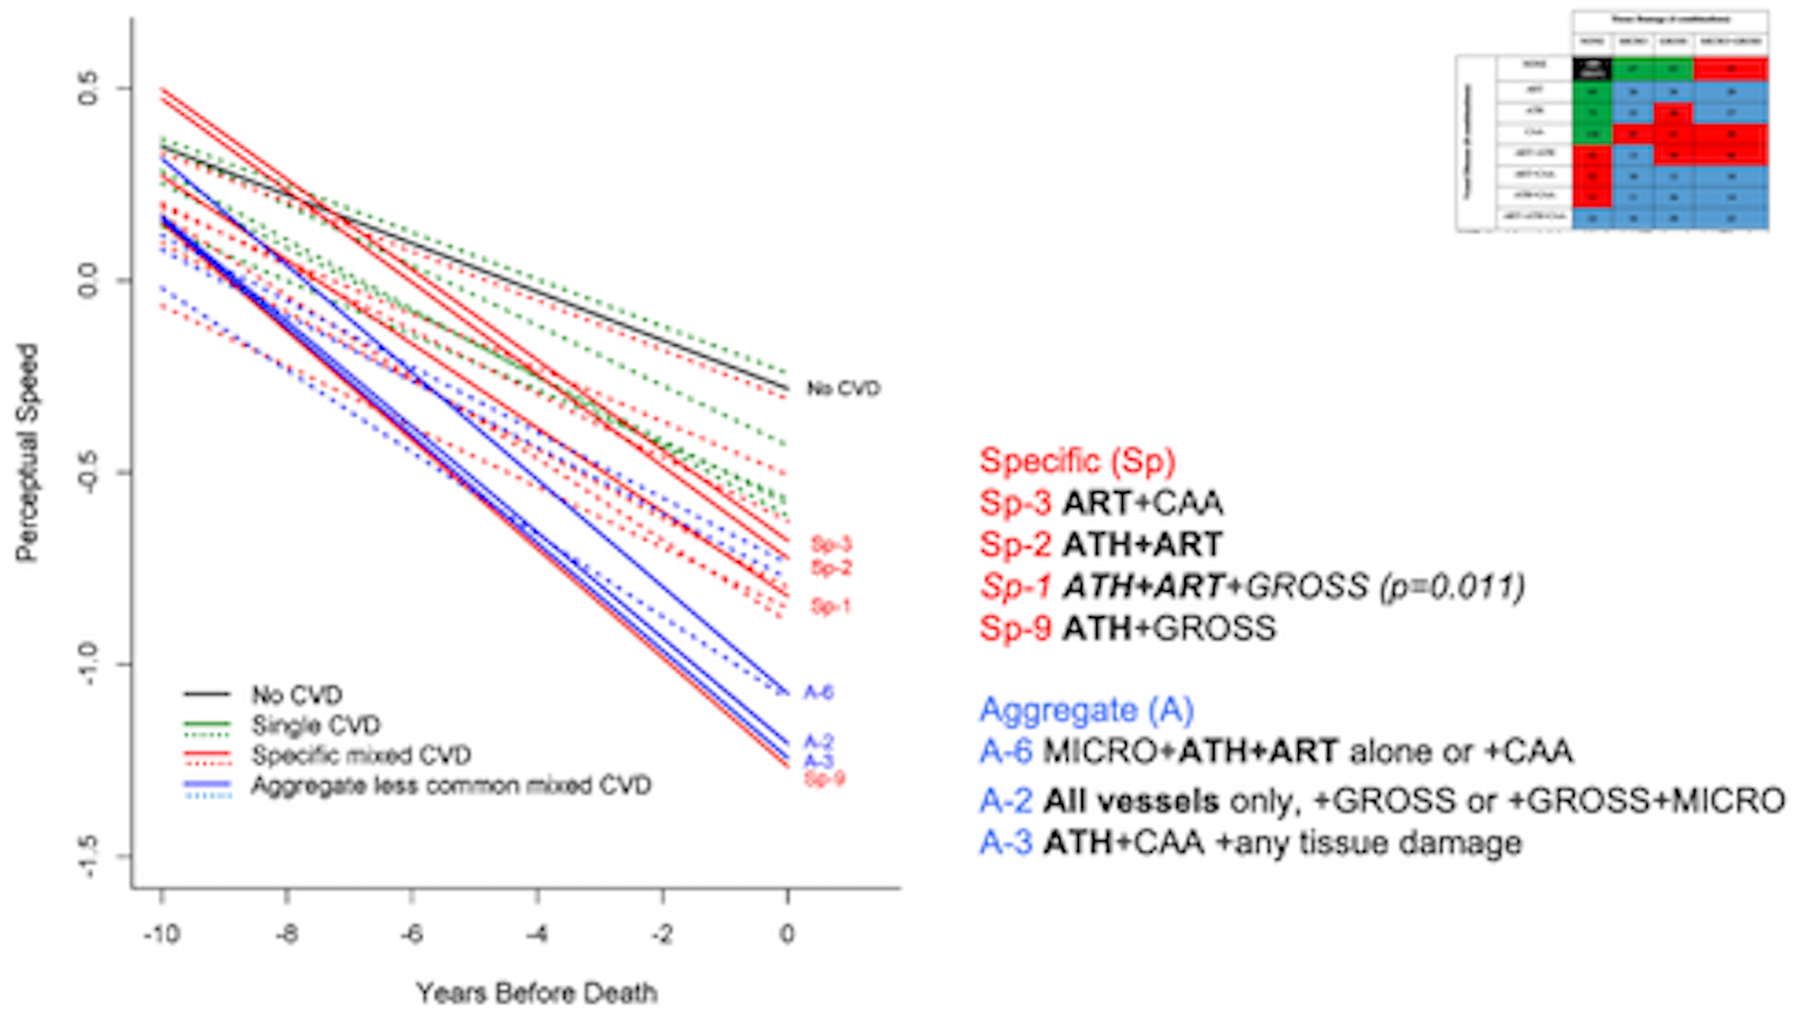
Figure 2.

The association of all Single CVD profiles (green), Specific mixed CVD profiles (in red), and Aggregated less common mixed CVD profiles (blue) with change in perceptual speed over time compared to the reference group (black). The model also included terms for age, sex, education, time (years before death), AD-Reagan diagnosis, hippocampal sclerosis, TDP43, and Lewy bodies, and their interactions with time. Significance, determined via 95% confidence intervals and a multiple comparison corrected p-value<.01, is indicated by solid red and/or blue lines and detailed to the right of the figure.
