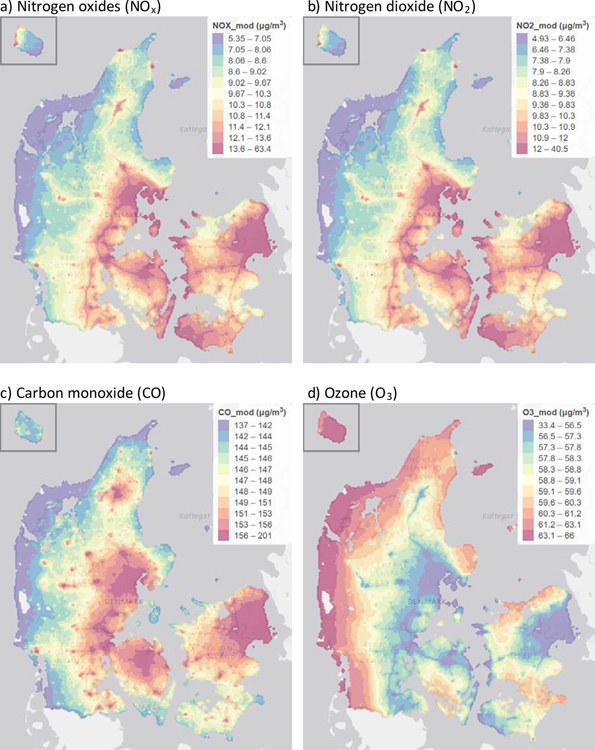
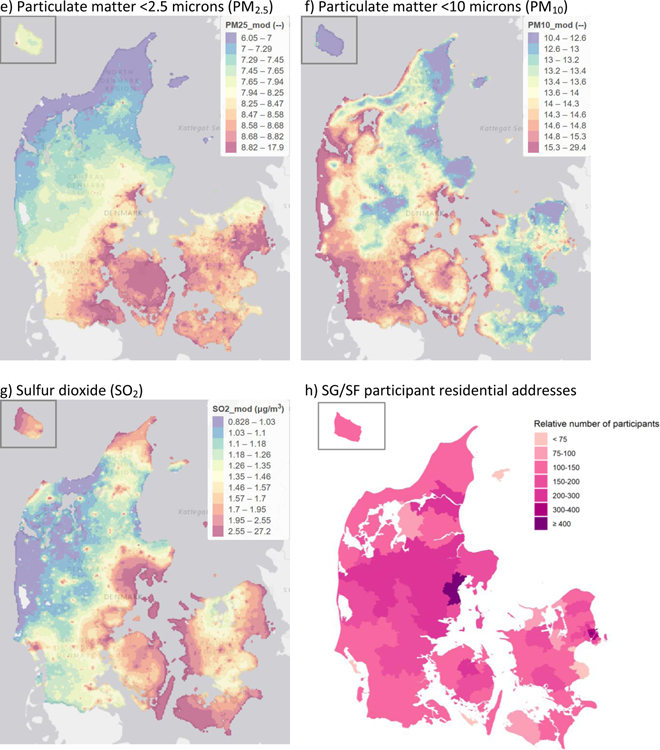
Figure 1.
Maps showing spatial distributions across Denmark of a) NOx, b) NO2, c) CO, d) O3, e) PM2.5, f) PM10, g) SO2 and h) SG/SF participants (number of participants per 100,000 inhabitants). Pollutant maps are annual averages of each pollutant during 2012, modelled with DEHM/UBM at 1km x 1km spatial resolution. Only areas with Danish residential addresses are displayed. Empty cells are unpopulated (i.e., water or forest). The data is displayed in quantile scale, with variable ranges in the color classes, arranged so that each color covers a similar total area in the map. Units for all pollutants are μg/m3.


