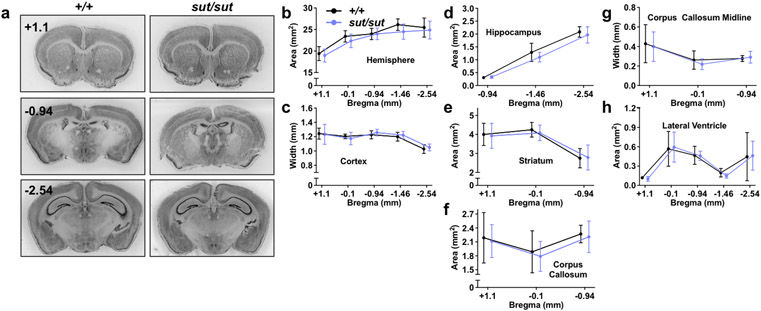
Figure 1. Gross morphological comparison between male SLC7A11+/+ and SLC7A11sut/sut littermate mice.
a-h) Gross brain morphological measurements were made on thionin-stained coronal brain sections from naïve 12 week old male SLC7A11+/+ (+/+; n = 7) and SLC7A11sut/sut (sut/sut; n = 8) littermates. Sections of 40 μm thickness were imaged using an Epson Digital Scanner at 720 dpi. Digitized images were processed and quantified using NIH Image J software. Representative thionin-stained coronal sections spanning +1.1 to −2.54 anterior to posterior from bregma from male SLC7A11+/+ and SLC7A11sut/sut mice derived from SLC7A11+/sut breeders are depicted in (a). Quantification of hemispheric area (b), cortical width (c), hippocampal area (d), striatal area (e), corpus callosum area (f), corpus callosum width (g), or lateral ventricle area (h) was performed in sections derived from SLC7A11+/+ and SLC7A11sut/sut mice over 3-5 coronal sections as described in Materials and Methods. Data are expressed as the mean ± SD width (mm) or area (mm2). Upon editor request, jitter was intentionally added to the x-axis of Figures 1B-F to aid in the visual presentation of the error bars. No significant genotype differences were observed (mixed-effects model with Šidák’s multiple comparisons).

