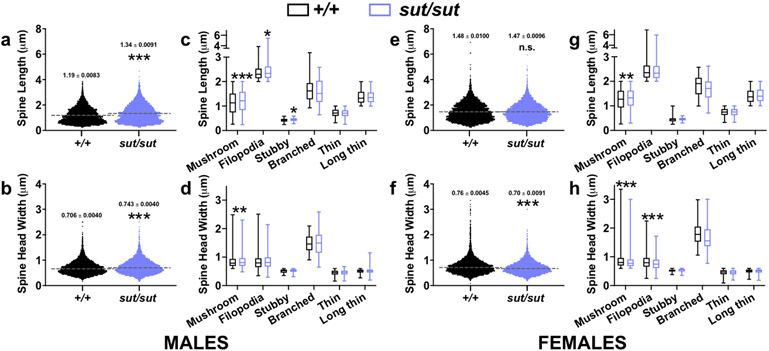
Figure 5. Comparison of spine lengths and spine head widths between male or female SLC7A11+/+ and SLC7A11sut/sut mice.
a, e, b, f) Scatterplots represent the distribution of spine length (a,e) or spine head width (b, f) variables in males (a-b) or females (e-f) used to derive length-to-width ratios in Fig. 4b or 4d, respectively, with the mean (dashed line) denoted. An asterisk (*) represents a significant between group difference (p < 0.0001, unpaired t test, n = 8-9 neurons/genotype in males, n = 9 neurons/genotype in females).
c, d, g, h) Box-and-whisker plots represent the distribution of male (c, d) or female (g, h) spine lengths (c, g) or spine head widths (d, h) from spines categorized as mushroom, filopodia, stubby, branched, thin, or long thin in Fig. 4b (males) or 4d (females). The lower, middle, and upper margins of the boxes represent the 25th percentile, the median, and the 75th percentile, respectively, whereas the whiskers represent the minimum and maximum values. An asterisk (*) represents a significant between group difference (*p < 0.05, **p < 0.01, ***p < 0.0001 unpaired t test, n = 8-9 neurons/genotype in males, n = 9 neurons/genotype in females).

