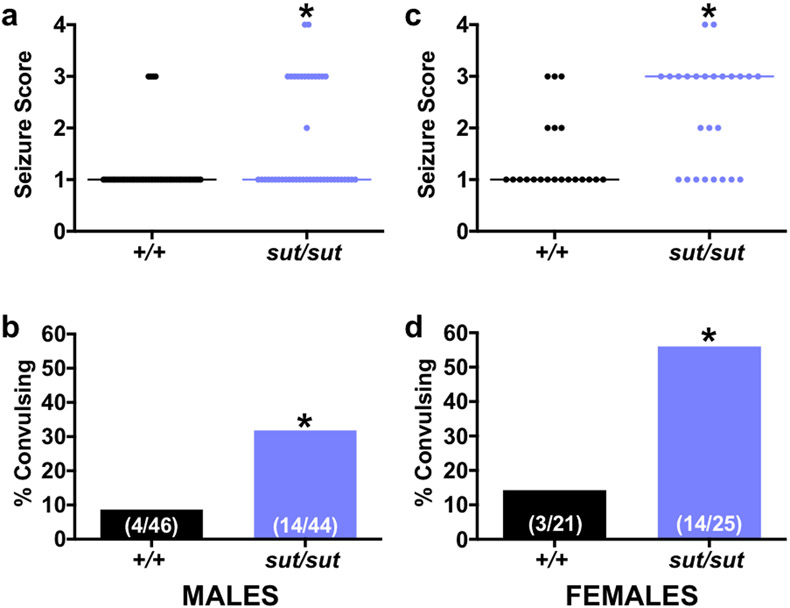
Figure 6. SLC7A11sut/sut mice are hyperexcitable following PTZ-administration.
Male (a-b) or female (c-d) naïve SLC7A11+/+ (+/+; n = 46 males or n = 21 females) and SLC7A11sut/sut (sut/sut; n = 44 males or n = 25 females) littermates were administered a single dose of 35 mg/kg (males) or 42 mg/kg (females) PTZ (i.p.). Seizure behavior was scored using a 5-point scale as described in Materials and Methods.
a, c) Individual seizure scores: Each data point [black circles (+/+) or blue circles (sut/sut)] represents the maximal seizure score obtained by an individual male (a) or female (c) mouse administered PTZ during a 30 min observation period. Horizontal lines represent the median seizure score for each genotype. An asterisk (*) represents a significant between group difference (a; p = 0.0031, c; p = 0.0030, Mann-Whitney U Test).
b, d) Convulsive index: Bars [black bar (+/+) or blue bar (sut/sut)] represent the proportion (fraction within bars) of male (b) or female (d) mice that experienced a convulsive seizure (seizure score ≥ 3) in a (b) or c (d) expressed as a % of total mice exposed to PTZ. An asterisk (*) represents a significant between group difference (b; p = 0.0081, d; p = 0.0054, Fisher’s Exact Test).

