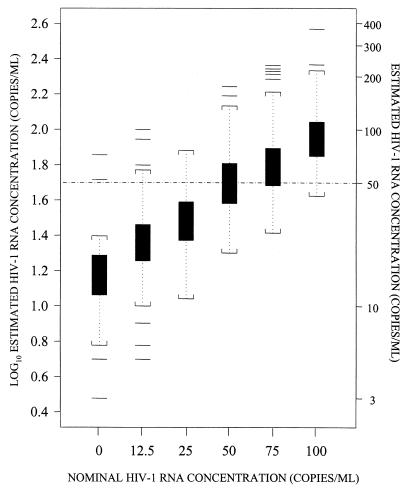
FIG. 1.
Box and whiskers plots of log10 estimated HIV-1 RNA concentration at nominal HIV-1 RNA concentrations up to 100 HIV-1 RNA copies/ml after recalculation of censored observations by using the standard curve for the bDNA 3.0 assay. Boxes extend from the 25th percentile (lower edge) to the 75th percentile (upper edge) HIV-1 RNA levels. The horizontal lines in the middle of the boxes indicate median HIV-1 RNA values. Whiskers are the vertical lines that end in brackets above and below the boxes. The horizontal lines beyond the brackets represent outliers (more than 1.5 times the interquartile range below the 25th percentile or above the 75th percentile). The brackets represent the largest and smallest observed values that are not outliers.

