
Figure 1. PON2 protein expression in brain regions of monkeys treated with pioglitazone (PIO).
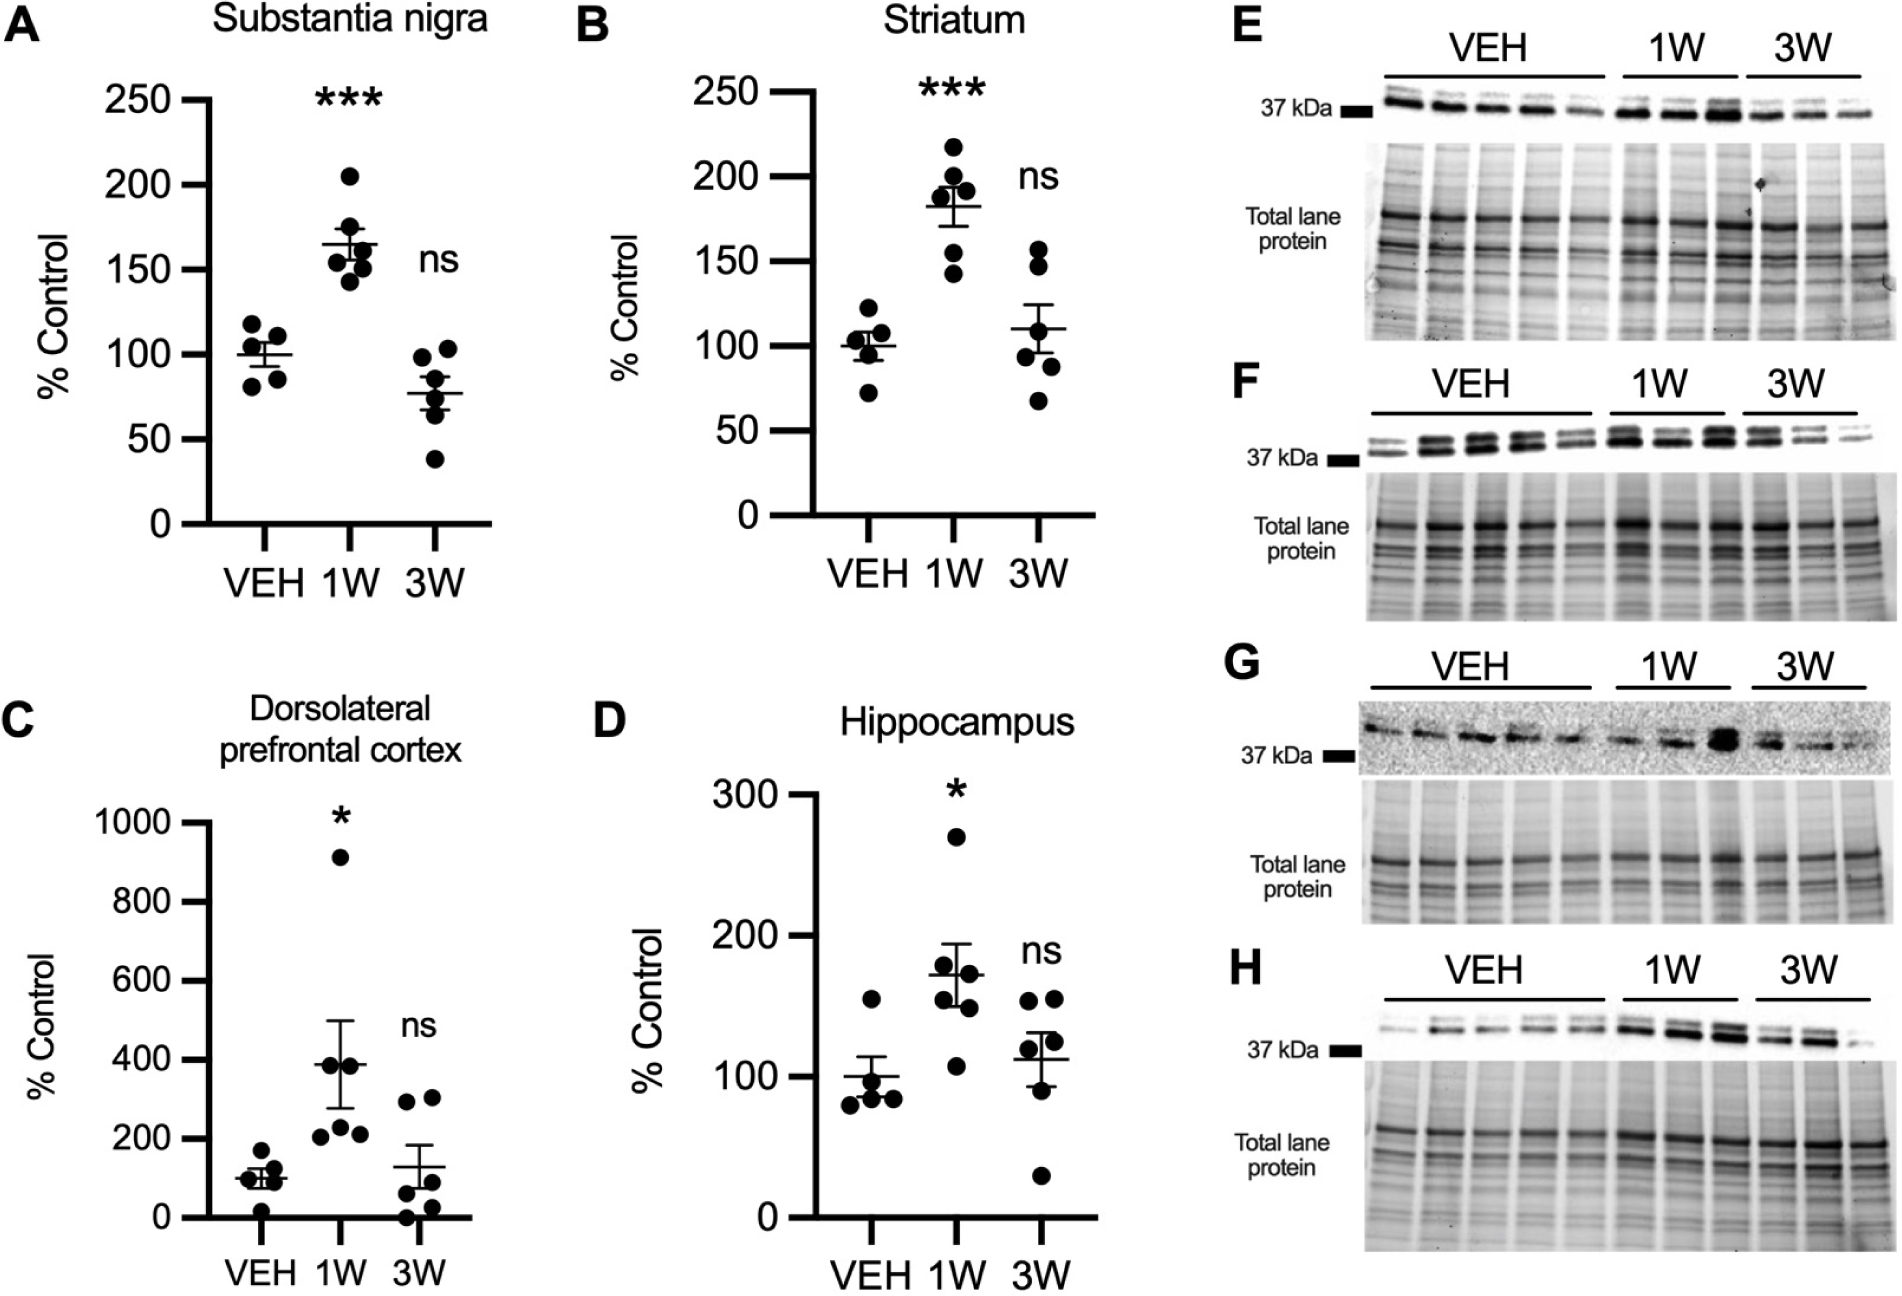
PON2 expression in PIO-treated monkeys (n = 6) relative to vehicle (VEH; n = 5) in in striatum (A), substantia nigra (B), dorsolateral prefrontal cortex (C), and hippocampus (D). Significant increases were found in 1 week group versus vehicle in striatum (p = .0006), substantia nigra (p <.0004), dorsolateral prefrontal cortex (p = .034), and hippocampus (p = .043). (E-H) Representative blot showing PON2 expression and corresponding image of total protein in striatum (E), substantia nigra (F), dorsolateral prefrontal cortex (G), and hippocampus (H). Optical density of 37 kDa PON2 bands were first normalized to total protein per lane and then to vehicle group mean. Results are presented as mean ± SEM. Asterisks indicate statistical significance in comparison to vehicle group, *p < .05, *** p < .001.